Chilat Doina
October 29, 2026
Only 18.4% of companies in a 2025 survey of 250 UK firms with turnover above £20 million achieved more than 80% of their aspirational growth goals within three years. 41.2% failed to reach at least 60% of those targets. Only 46% had a clearly measurable gap between current performance and the aspiration, and 50.4% named talent and capability shortages as the main execution barrier.
That is the main problem when you learn how to set business goals. The sentence on the slide is rarely what breaks. The break is capacity, decision rights, and a missing rule for when the target should change. A revenue number without people, inventory, cash, and an owner is a wish.
What follows is the operating system I would use on an ecommerce brand: horizons, a framework matched to team size, a seven-step build, KPIs with guardrails, a capacity test before you commit, model-specific examples, a review cadence, and a one-page template.
A goal without a horizon drifts. It gets discussed in every meeting and owned in none of them.
Annual goals name one to three enterprise outcomes. Contribution profit, cash conversion, and repeat-purchase rate steer a brand. Quarterly goals turn each outcome into a measurable target with one owner, a baseline, and an explicit calculation method. Monthly goals track leading indicators and initiative milestones. Weekly goals are the tests and tasks that move those indicators. Each goal sits at exactly one horizon, and its owner knows which review it belongs to.
Formal planning is what makes that stack work. A 2019 meta-analysis in Public Administration Review examined 87 correlations from 31 empirical studies and found a positive, moderate, statistically significant link between strategic planning and performance, with population effect sizes of 0.229 and 0.255 (p below 0.001). The relationship held in private and public organizations, and in U.S. and non-U.S. settings. Outcomes were strongest when planning was formal and performance was measured as effectiveness, meaning how well the organization achieved its objectives.
One horizon, one owner: If a goal is both an annual promise and a weekly task, it will be rewritten every time someone is late.
A $10 million revenue target means little on its own. It becomes usable when you connect the target market, the contribution margin you need, inventory capacity, customer-acquisition limits, cash-flow requirements, and milestones by quarter. That is the same discipline you would use in strategic planning for a small business: specify the outcome, name the route, assign ownership, and track effectiveness against a baseline.
Check every goal you have drafted. Does it sit at exactly one horizon, and does its owner know which review it belongs to?
Under roughly ten people, use SMART targets for budget lines and individual commitments, plus one OKR set for the quarter. Above that size, add an OKR layer per function.
An OKR is one objective with two to five key results, usually scored from 0.0 to 1.0, checked weekly, and scored at quarter-end. A SMART goal is a target that is specific, measurable, achievable, relevant, and time-bound. SMART fits a media budget, a hire, or a service-level promise. OKRs fit a cross-functional bet where marketing, ops, and finance have to move together.
| Criterion | OKRs | SMART goals |
|---|---|---|
| Core unit | One objective with two to five key results | One target statement tested against five criteria |
| Best use | Cross-functional quarterly priorities | Budget lines, individual targets, and operating commitments |
| Ambition level | Stretch, scored 0.0 to 1.0 | Realistic, committed targets |
| Review rhythm | Weekly check-ins and a quarterly score | Periodic progress check against the target |
| Failure mode | Key results with no owner or no measurement | Measurable targets disconnected from strategy |
A meta-analysis of Locke's goal-setting literature backed two conclusions that still run a planning meeting. Hard goals generally beat easy goals. Specific goals beat "do your best" directions or having no goals. The strength of those effects changes when goals are assigned rather than built with the people who must hit them. That matters when you manage marketing, operations, finance, and product as separate functions.
Ambition has to come with precision. "Grow the brand" can't be executed or scored. "Increase twelve-month contribution profit by 25% while keeping return rates below 8%" states the result and the constraint. Build a short hierarchy under it: an annual outcome, quarterly milestones, weekly leading indicators, and named owners. Use conversion rate, advertising efficiency, repeat-purchase rate, inventory turnover, and contribution margin, not revenue alone.
Challenging goals still have to be credible. A target the team can't resource, can't decide, and can't see feedback on will kill commitment. OKRs fail when a key result has no owner. SMART goals fail when they are measurable and still disconnected from the strategy. If you want a plain walkthrough of the five SMART tests before you write the quarter, set smarter business goals with that checklist, then come back and attach each line to an owner.
I would not run a full OKR stack on a five-person brand. You will spend the quarter maintaining the system.
Say a DTC skincare brand does $6 million a year at a 28% contribution margin and wants $9 million without giving that margin back. A revenue sentence is not the goal. The goal is the cascade underneath it.
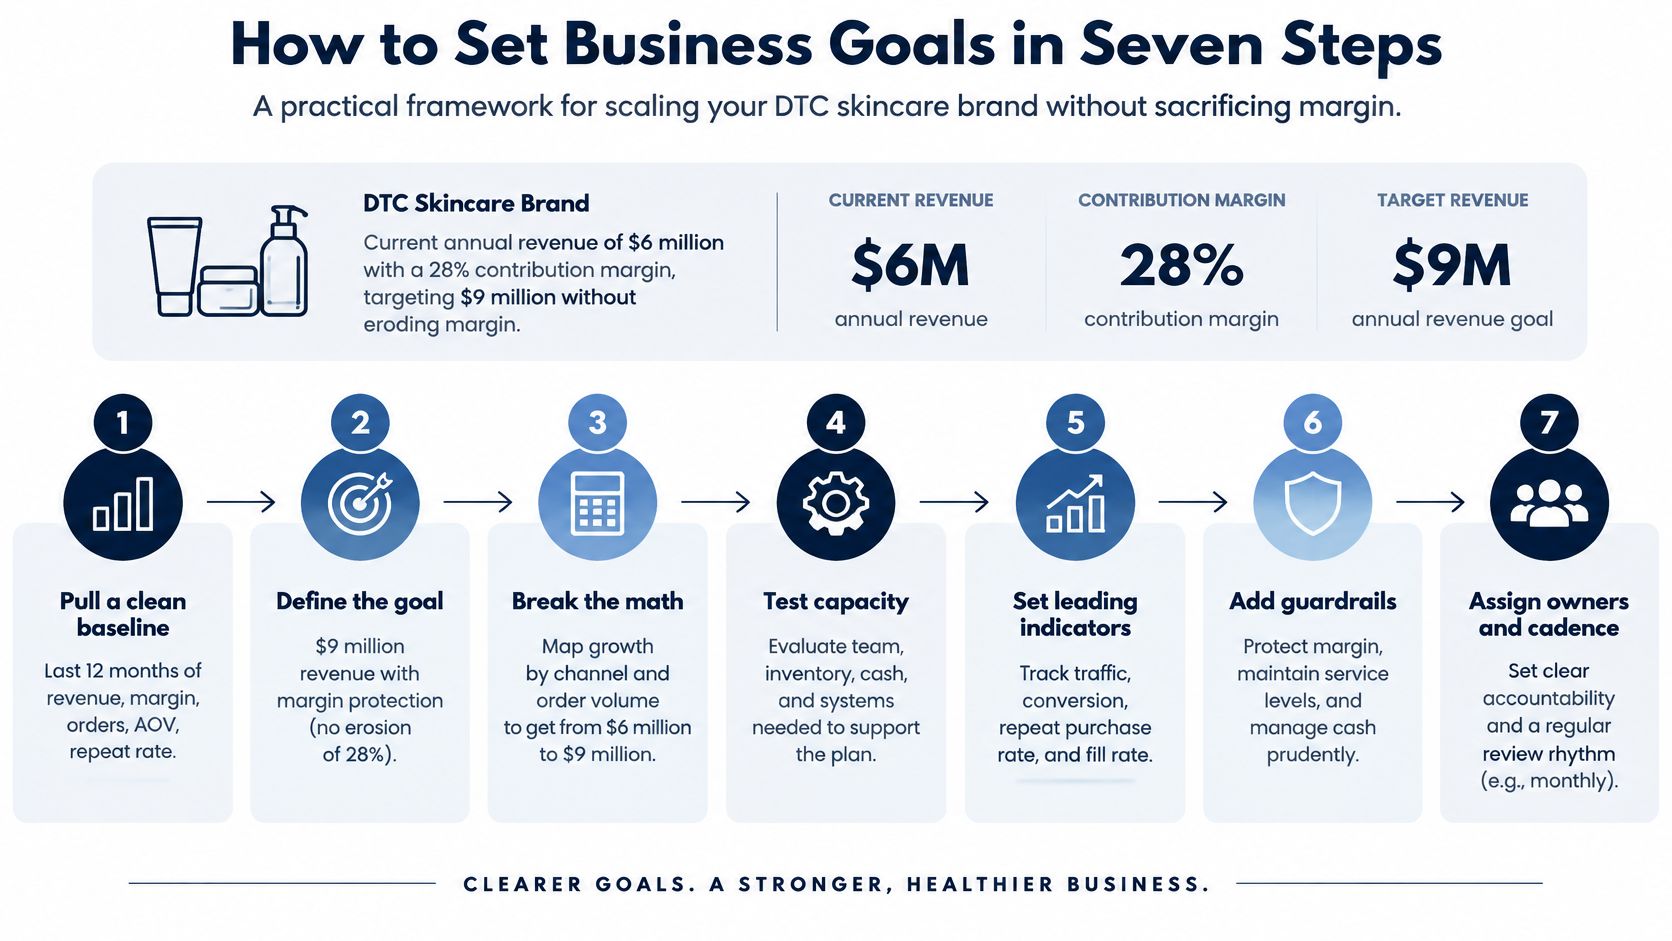
This cascade exists because strategy and Tuesday rarely meet. In PMI's research on strategy implementation, 61% of executives said their organizations struggled to bridge strategy formulation and day-to-day implementation, and only 56% of strategic initiatives achieved their original goals and business intent. Alignment changes the odds. Organizations reporting high project-to-strategy alignment averaged 65% of initiatives meeting original goals, versus 35% among those reporting low alignment.
Every approved goal shows its strategic parent, financial impact, operating owner, leading indicators, and stop/go thresholds.
A finished set is one page per outcome that a teammate can explain back: how the number is calculated, what would make them stop, and who decides. Content work is one of those drivers, not a side project. A practical blogging roadmap for Shopify merchants is a useful way to turn "publish more" into a velocity target with an owner, the same way you would treat conversion or fill rate.
"Grow the brand" can't be tracked. A sentence with a formula, a constraint, and a date can. Pick three to five KPIs per outcome. Keep a metric only if someone can move it inside a quarter. Drop vanity measures such as total sessions unless they feed conversion or margin.
| KPI | Formula | Why it matters | Guardrail example |
|---|---|---|---|
| Contribution margin | (Net revenue minus COGS, fulfillment, ad spend, and returns) divided by net revenue | Shows whether growth earns money | Floor of 20% on a monthly basis |
| Marketing efficiency ratio | Total ad spend divided by total revenue | Measures efficiency across all channels | Ceiling set separately for each channel |
| Repeat purchase rate | Customers with two or more orders divided by customers in the cohort | Drives lifetime value | Read alongside cohort payback period |
| Conversion rate | Orders divided by sessions | Connects traffic to revenue | Read alongside average order value |
| Return rate | Returned units divided by units shipped | Protects margin | Ceiling of 8% on core SKUs |
| Inventory cover | Units on hand divided by average daily sales | Prevents stockouts and overstock | Minimum days of cover on top SKUs |
| Cash conversion cycle | Days inventory plus days receivable minus days payable | Shows cash available for growth | Minimum cash runway in months |
Contribution margin subtracts cost of goods, fulfillment, advertising, and returns, then divides by net revenue. Stopping at product cost will make a paid-social push look profitable while returns and pick fees eat the quarter. Guardrails matter as much as the growth metric. A revenue increase with rising returns or thinner inventory cover is not a win. Set the numeric floors and ceilings from your own baseline. The 20% margin floor and 8% return ceiling in the table are illustrations, not universal standards.
Cascade each KPI to one named owner. Marketing owns conversion and ad efficiency. Operations owns inventory cover and fulfillment capacity. Finance owns contribution margin and the cash conversion cycle. Every person's goal uses the same formula, so two people can't report two versions of one outcome. A deeper cut on key performance indicators for ecommerce helps you decide which of these belong on the weekly page versus the monthly pack. If you are still choosing the first set, how to choose startup performance indicators is a clean filter for metrics a small team can collect.
A KPI is ready when it has a formula, a data source someone can open, a baseline, a named owner, and a threshold that triggers action. If any of those is missing, leave it off the dashboard.
One caution on outside benchmarks. Widely repeated claims that 50% to 90% of strategies fail rest on outdated, fragmentary, or weak evidence, according to a peer-reviewed review in the Journal of Management & Organization. Track your own execution funnel. Don't import a generic failure rate and manage to it.
A bigger target is the easy move and usually the wrong first move. A revenue figure is not executable until the business has the people, decision rights, inventory, cash, technology, and operating rhythm to deliver it.

Take the skincare path from $6 million toward $9 million. At a 28% contribution margin, $9 million of sales produces about $2.52 million of contribution. If ad costs rise and margin falls to 24%, the same $9 million produces $2.16 million. You "hit" the revenue goal and give up roughly $360,000 of contribution. That is the forecast you should see before anyone commits.
Build three scenarios, not one.
Attach the margin and cash result to each case. A walkthrough of what financial forecasting actually includes is worth doing before you lock the media budget to the upside case.
Run a pre-commitment check, and don't approve a goal that fails it.
Then apply a resource trade-off rule. Name the initiative, SKU, market, or channel that will get less attention. If nothing loses, you didn't make a choice.
Close the goal with an implementation intention. If-then plans that specify when, where, and how the action will happen improve attainment. "If return rate on the hero SKU exceeds the ceiling for two weeks, then the growth lead pauses prospecting spend on Friday and finance restates the quarter." That sentence is the goal's operating instruction.
Teams that skip this audit discover the constraint in month two, usually in a meeting that looks like this and decides nothing.
These rows are starting points, not targets to copy. Each one pairs a result with leading indicators the team can move inside a month, plus a guardrail so a nominal win can't hide a loss. If the leading indicator isn't controllable within a month, you will track the goal and never manage it.

An Amazon seller should not set "rank higher" as the goal. Contribution profit with advertising cost held under a ceiling forces the catalog and the ads to serve the same P&L. Buy box share, conversion, and organic rank on the top 20 listings tell you, weekly, whether the profit target is still alive. A stockout ceiling stops you from "winning" by going out of stock on the hero ASIN.
A DTC brand often grows by buying more customers and damaging repeat purchases. The better parent goal is repeat purchase over two quarters without giving margin back. Email-to-order rate, subscription sign-ups, and second-order timing are the levers. A return-rate ceiling keeps a subscription push from filling the warehouse with refunds.
An omnichannel brand pursuing retail doors can damage price and cash simultaneously. Increasing retail-sourced revenue toward a set share of total, while maintaining channel price parity, is a clearer goal than "get into retail." Store sell-through and wholesale fill rate show whether doors are selling. A minimum cash runway prevents you from funding fixtures with money you need for replenishment.
A hybrid Amazon-plus-DTC brand usually has the opposite problem: paid demand on one channel subsidizing a weak owned channel. Shifting ad budget toward branded search and owned traffic only works if marketing efficiency has a floor by channel. Otherwise the shift just makes acquisition more expensive under a nicer story.
| Business model | Example goal | Leading indicators | Guardrail |
|---|---|---|---|
| Amazon seller | Grow contribution profit with advertising cost held under a set ceiling | Buy box share, conversion rate, organic rank for top 20 listings | Stockout rate under 2% |
| DTC brand | Lift repeat purchase rate over two quarters without margin loss | Email-to-order rate, subscription sign-ups, second-order timing | Return rate under 8% |
| Omnichannel brand | Lift retail-sourced revenue to 25% of total with channel price parity | Store sell-through, wholesale fill rate, marketplace price parity | Cash runway above six months |
| Amazon plus DTC hybrid | Shift ad budget toward owned channels while holding marketing efficiency | Branded traffic share, owned-channel conversion rate | Marketing efficiency ratio ceiling set per channel |
Pick the row closest to your model. Rewrite every number from your own baseline, and delete any indicator nobody can move this month.
A target is only useful while the assumptions behind it still hold. Set a review rhythm that separates a temporary miss from a capacity problem or a change in market conditions.
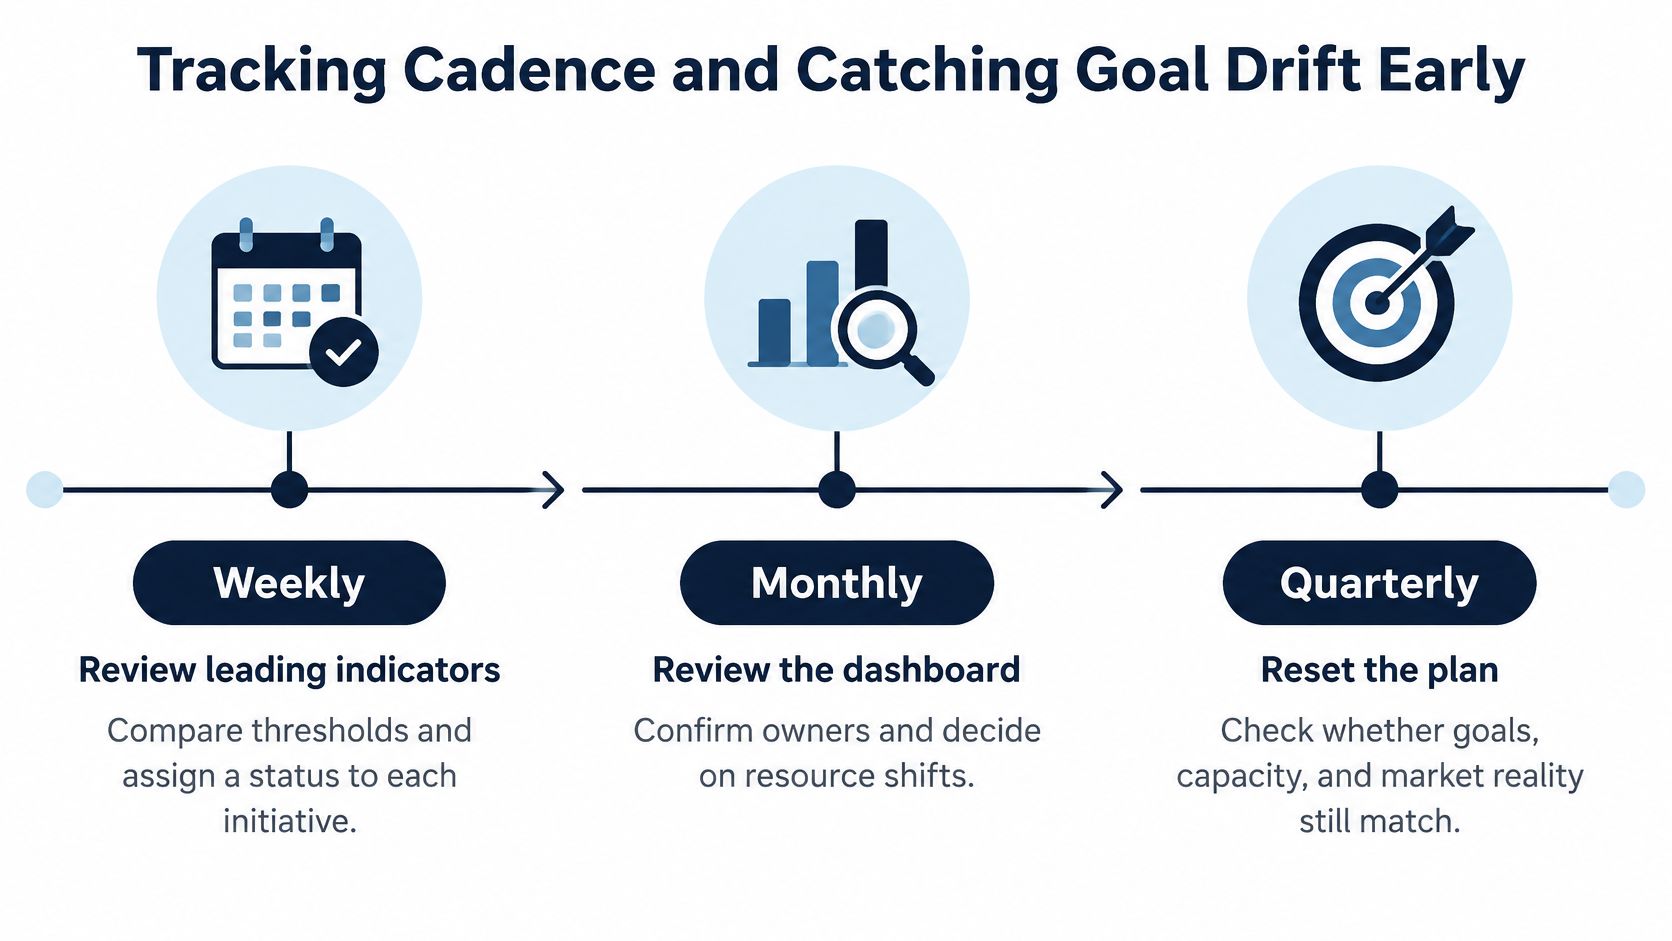
Weekly, compare leading indicators with their thresholds and mark each initiative on track, at risk, or off track. For anything at risk, assign a recovery action and an owner before the meeting ends. Monthly, review the dashboard, confirm owners still have the authority and resources to act, and decide whether to shift capacity. Quarterly, test results against the goal and decide whether to continue, re-scope, or stop. Re-scope or stop when the forecasted return no longer justifies the cash and hours the initiative uses.
Retail conditions can change before an annual target does. In the 2025 Linnworks retail resilience report, 88% of UK and 81% of US ecommerce decision-makers reported higher costs in the past year. The report also found that 84% and 85%, respectively, saw trade or supply disruptions as a major or moderate concern. A fixed target can become unworkable when those pressures undermine the assumptions behind its forecast.
Keep the strategic destination stable, but make channel, product, and timing targets conditional on leading indicators. Set guardrails for minimum contribution margin, inventory cover, cash runway, and acceptable acquisition payback. Define the reset trigger in advance: revise, pause, or replace the goal only when a guardrail stays broken for a specified stretch, not after one soft week.
Give one person authority to reset the target, and require the reason to be recorded. Until that decision is documented, everyone executes the current version.
That decision right prevents each bad week from turning into a new strategy. It also makes accountability clearer: teams know who can change the target and what evidence must support the change.
Watch for these signs of drift:
Pick one enterprise outcome this week. Fill the template for that outcome only. Book the first weekly review before the quarter starts, not after the first miss.
| Field | What to write | Example entry |
|---|---|---|
| Goal name | Verb plus measurable outcome | Lift 12-month contribution profit by 25% with return rate under 8% |
| Enterprise outcome | Which outcome this serves | Contribution profit |
| Owner | One named person | Head of growth |
| Baseline and data source | Current value and where it comes from | Trailing 12-month contribution from the finance ledger |
| Calculation method | Exact formula | Net revenue minus COGS, fulfillment, ad spend, and returns, divided by net revenue |
| Quarterly target | Number per quarter | Q1 contribution profit at least 6% above the trailing baseline |
| Drivers | Controllable inputs | Traffic, conversion rate, average order value, repeat rate |
| Leading indicators | Weekly measures | Conversion rate, return rate, subscription sign-ups |
| Guardrails | Limits that stop a false win | Return rate under 8%, inventory cover above 45 days |
| Resources required | Labor, inventory, media, tools, and cash | Labor hours, units covering lead time, media budget, tool licences, cash runway in months |
| Stop and go thresholds | Triggers for continue, re-scope, or stop | Stop if two consecutive months fall below the Q1 pace |
| Reset trigger | Evidence that justifies a change | Repeat rate below 20% for two cohorts, with written approval from the founder |
Hand the page to someone who didn't write it. They should be able to say how the number is measured, what would make the team stop, and who decides. If they can't, the goal isn't finished. Share the draft with operators who have run a similar model and will argue with the assumptions before the budget is spent. A peer group such as Million Dollar Sellers is one place to do that pressure test. Your finance lead and your ops lead are the other two.
Then put the first monthly review on the calendar now. A goal that waits for the quarter to end before anyone looks at it was never a commitment.
Million Dollar Sellers is an invite-only community of ecommerce founders running Amazon, DTC, and omnichannel brands, with peer forums, mastermind calls, and working sessions on the operating targets that move a P&L. If you want operators who will challenge your contribution target, your capacity assumptions, and your reset rules before you lock the quarter, visit Million Dollar Sellers and see whether the room fits the way you already run the business.
Join the Ecom Entrepreneur Community for Vetted 7-9 Figure Ecommerce Founders
Learn MoreYou may also like:
Learn more about our special events!
Check Events