Chilat Doina
November 16, 2026
The most repeated piece of advice in omnichannel fulfillment is to pool every unit of inventory into one shared pot and let software decide where each order ships from. It sounds like the obvious end state. No channel owns stock, nothing sits idle, and the routing engine always finds the nearest available unit.
That advice breaks the moment channels carry different obligations. A single pool optimizes for the next order in the queue. A contractual fill rate optimizes for the whole quarter, and one high-margin direct order can consume the last units a retail account was already promised. The pool looks clean on a dashboard and expensive at the moment a chargeback lands.
A workable omnichannel fulfillment strategy starts by admitting that inventory can't be optimized for every channel at once. What follows is a decision model for where stock sits, which node picks each order, and what delivery promise you're allowed to make, built from measured network studies rather than intuition.
Think of the strategy as an air traffic controller, not a runway. A runway accepts whatever lands first and hopes the schedule holds. A controller looks at every inbound flight, knows which gates are free, which aircraft are too large for a given stand, and which arrivals can be held in a pattern without burning fuel. Fulfillment works the same way: the job isn't to have capacity, it's to decide, order by order, which node should accept the work.
Three layers sit under that decision, and each one has an owner in a functioning operation.
The nodes feeding those layers are distribution centers, retail stores, factories shipping direct to the customer, and third-party marketplace warehouses. A strategy that only names two of the four is really a warehouse plan with a marketing label.
Siloed operations fail in a specific, repeatable way. The web shop counts 30 units and the store counts 30 units, both sell the same physical 30, and the second customer gets a cancellation email rather than a parcel. Nobody made an error inside either system. The error lives in the gap between them.
The test of a real strategy: if a customer can buy a unit that another channel has already committed, you have two inventories and one lie.
Performance depends on how orders are allocated among distribution centers, factories, stores and marketplace nodes. That makes this an operating-model decision, not a campaign. Which node fulfills each order, which stock is reserved for which channel, and which delivery promise the customer sees are the three questions every version of the strategy has to answer before a single order is routed.
A 2022 peer-reviewed study in Manufacturing & Service Operations Management put numbers on what each added node buys. Researchers compared a single distribution center baseline against a dual distribution center network and a factory-direct model, measuring fill rate, lead time and cost against the same starting point.
| Network design | Order fill rate | Lead time | Fulfillment cost |
|---|---|---|---|
| Single distribution center (baseline) | Baseline | Baseline | Baseline |
| Dual distribution centers | +0.4% | -9.7% | No added cost |
| Factory-direct | +0.5% | +12.5% | -5.2% |
Read the percentages in context. A dual distribution center network raised order fill rate by 0.4% and cut lead time by 9.7%, with no added cost. A factory-direct model lifted fill rate by 0.5% and trimmed costs by 5.2%, but its lead time ran 12.5% longer. Those are the findings reported in the Manufacturing & Service Operations Management study.
None of these look dramatic in isolation. They compound. Take a brand shipping 50,000 orders a month. Four tenths of a percentage point of fill rate is 200 orders that go out complete instead of partially or not at all, and a partial shipment usually costs more to handle than a clean one. A 9.7% cut on a five-day promise buys back roughly half a day of transit, which is often the difference between hitting a marketplace's on-time threshold and losing placement.
The trade-off is structural rather than temporary. Every node you add inserts another transportation leg, another system that has to agree on stock positions, and another way for the promise date to slip. That's why the factory-direct row wins on cost and loses on speed: the unit cost falls, but the parcel now travels the full distance instead of starting near the buyer.
To use the table, match the row to your bottleneck. If the problem is stockouts on popular SKUs, chase the fill rate column. If it's late delivery against a promise, look at lead time. If margin is being eaten by split shipments and expedited freight, watch cost.
The right model depends on where demand sits and which service levels you've promised. The delivery promise is set by carrier selection as much as node selection, which is why shipping optimization belongs in the same planning cycle as network design rather than running as a separate cost exercise. Routing rules are what turn all of this into a decision someone makes every morning.
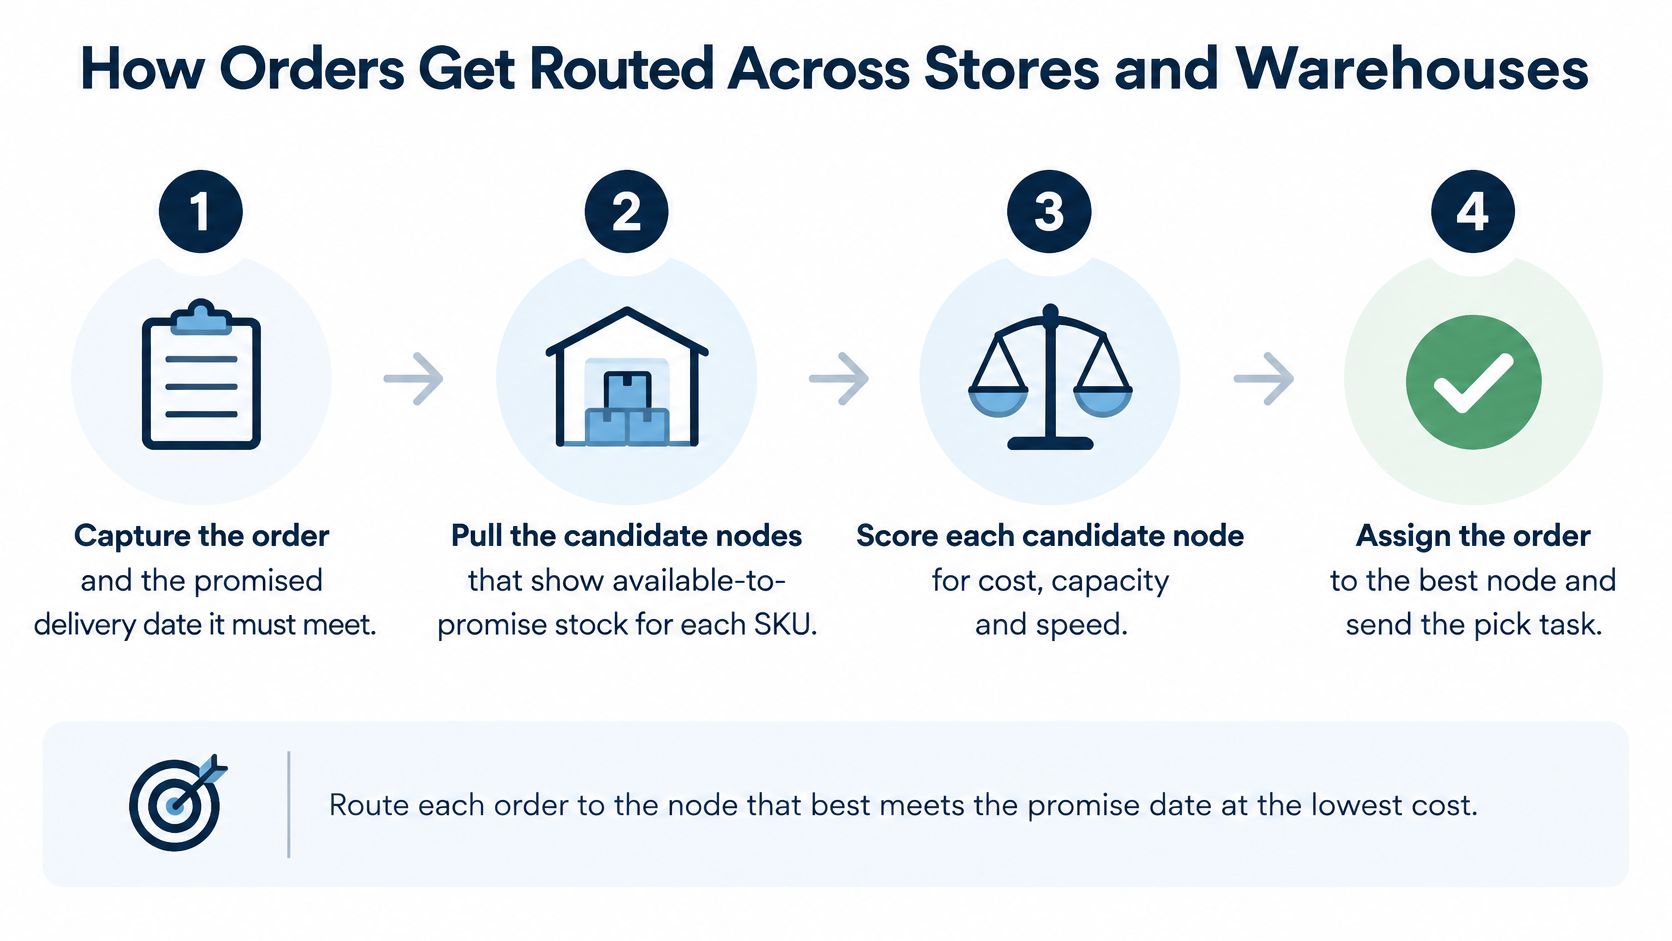
A router that treats every unit as interchangeable assigns the wrong node first. The sequence that holds under volume scores pick risk and reserves stock at the same moment it commits a date, so one channel cannot sell units another channel has already promised.
Fixed policies lose to hybrid ones. Models in Transportation Research Part E compare four designs, ship-from-store, ship-from-warehouse, a combined store-and-warehouse model, and warehouse fulfillment replenished through store inventory, while jointly optimizing facility location, capacity and product flow, and find that ship-from-warehouse produced higher profit than ship-from-store across four studied product categories. The combined design beat either restricted design, and its advantage grew as online demand became a larger share of total demand.
That profit gap is a routing result, not a case for one shared pool. The combined design can still refuse a node when pick risk is high, then fall back before the promise is confirmed. A single available-to-promise number hides that choice. Channel-specific reserves make it explicit: step 5 locks only the units that channel is allowed to use, and the score in step 3 down-ranks a node whose shelf record is the weak point. Margin holds because the router pays the cheaper, reliable pick when the date allows it, and spends proximity only when the promise requires it.
Three building blocks make the sequence enforceable. A unified order-management layer sees every channel's orders and every node's capacity. Inventory is visible across nodes at the data level, while allocation stays split by channel and by pick-reliability rules. SKU-level fulfillment-cost curves let the router compare real cost per unit instead of a flat shipping estimate that is wrong for half the catalogue.
A marketplace order, a direct-site order, and a retail replenishment can all claim the last eight units of a fast mover. The site shows stock, the router confirms it, and the higher-gross-margin direct order ships. Two days later the retail account's replenishment goes short against a contracted fill rate, and the penalty arrives as a deduction on the next invoice. Nothing flagged a conflict, because nothing in the system priced the commitment.
Visibility does not close that decision. Analysts at MIT's Center for Transportation and Logistics report that integration is still a challenge for 51% of respondents and order fulfillment for 50%, that visibility and cost allocation affect 51% and 50% respectively, and, citing Deloitte, that one-third of retail executives planned significant investment in real-time inventory visibility, unified customer views, and multiple fulfillment options. The counts can be shared across channels and the shortage still go to the wrong one.
Once stock is visible, the decision is who receives it when there is not enough. Compare channels on the same SKU using obligations, not revenue alone.
| Metric | What it reveals | When it should change allocation |
|---|---|---|
| Contribution margin after fulfillment | Profit per order after picking, shipping and marketplace fees | A margin gap opens between channels on the same SKU |
| Cancellation risk | The chance promised stock fails to ship | Cancellations rise on one channel |
| Customer lifetime value | Future value of customers acquired through the channel | Repeat purchase rates differ sharply by channel |
| Marketplace penalties | Fines or ranking losses for late or cancelled orders | Stock approaches the penalty threshold |
| Retail service-level agreement | Contracted fill-rate or delivery commitment | Available stock falls below the contracted level |
Contribution margin after fulfillment belongs at the top of that list because gross margin misleads. A marketplace sale at 55% gross margin that pays referral fees, fulfillment fees, and a returns allowance can net less than a 40% direct sale shipped in a flat-rate parcel. Rank channels per SKU on the number that survives the fees.
Then size reserves to written commitments rather than to a preference for one channel. Hold back enough units to cover each obligation, and release unused reserve on a fixed daily cycle so a buffer cannot harden into a permanent silo. Getting the counts right at that level is the same discipline covered in these inventory tips for ecommerce sellers storing stock, applied per location instead of per warehouse. A single order-management view of those reserves is what omnichannel inventory management means once you get past the dashboard.
Reserve rule: fund each channel's reserve from its written commitment, review it weekly, and let the router spend whatever the reserve doesn't claim.
One pool still wins when channels behave alike: similar margins, similar volatility, no contractual fill rates. Channel-specific reserves protect profit when margins, demand volatility, or contract terms differ. For most consumer brands, that split is the normal condition, not the exception.
The inventory record and the shelf are two different documents. A store can show twelve units and physically hold nine, because three are misplaced in a fitting room, reserved for a walk-in customer, damaged in handling, or sitting in a returns bin waiting for inspection. Ship-from-store programs that trust the record treat a probability as a certainty.
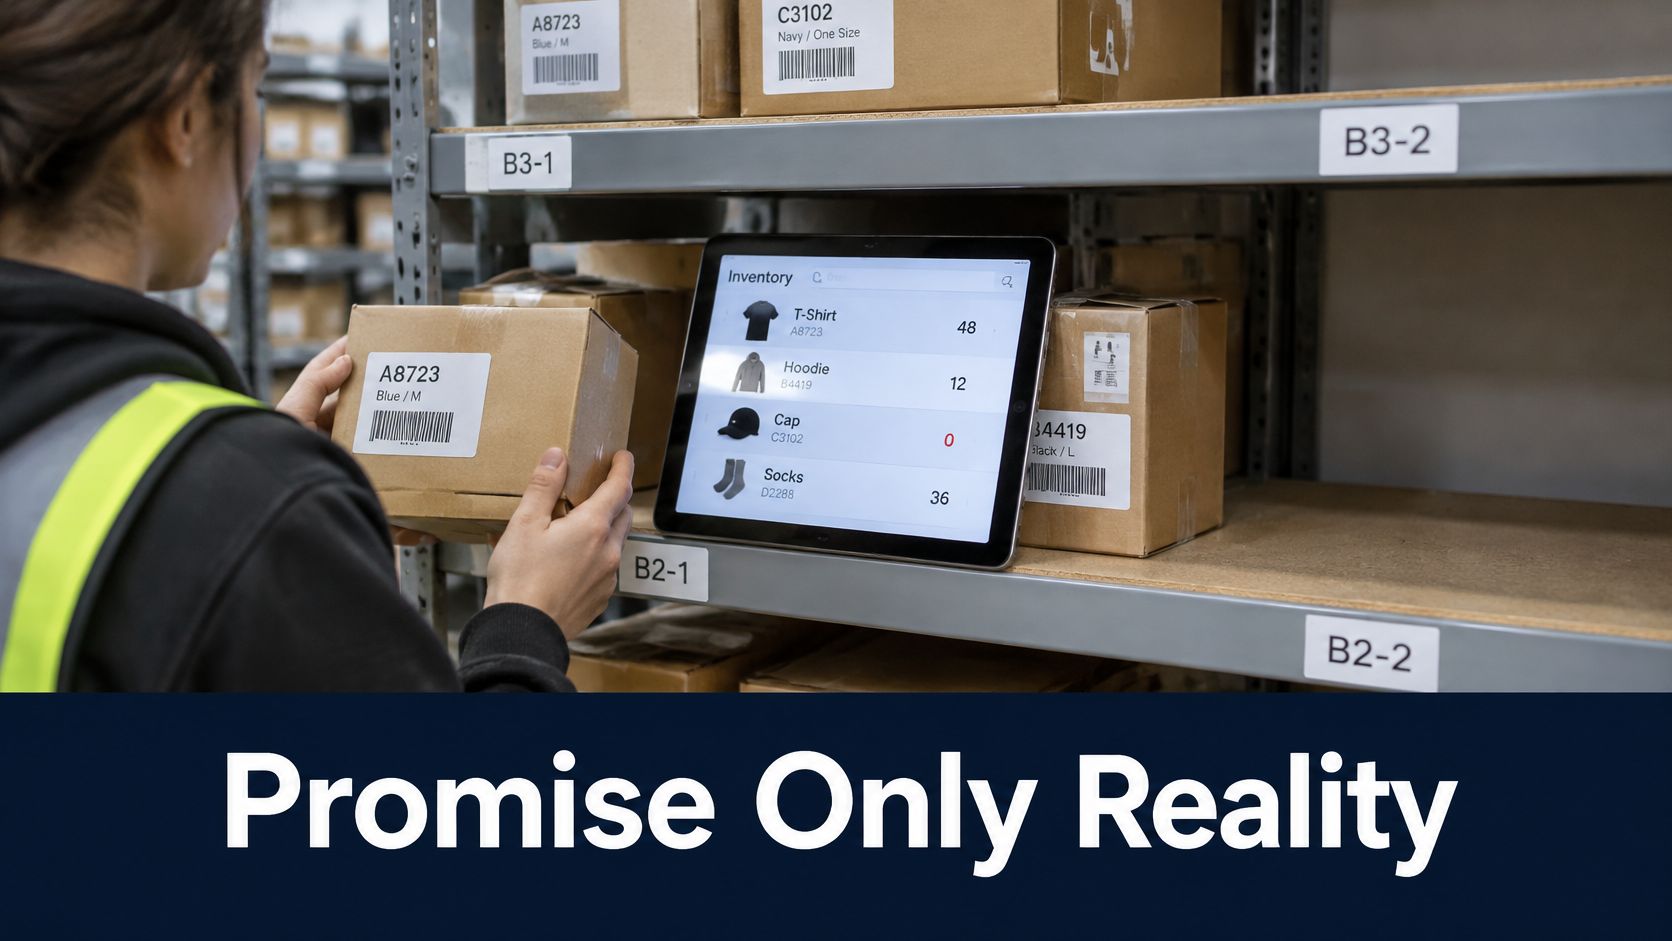
Modelling that uncertainty pays. Researchers using real order data from major U.S. retailers framed fulfillment as a multistage network-flow problem, sequencing store-pick attempts while updating the probability of failure after each trial, and linked order acceptance, store selection, cancellation risk and shipping cost instead of optimizing each separately. Folding pick-failure probabilities into online order-acceptance policies reduced relevant omnichannel fulfillment costs by as much as 22%, as Carnegie Mellon's Tepper School reports.
Three operating steps turn that into something a team can run.
Then watch four numbers by node and SKU group.
| Metric | How to calculate it | What a decline means |
|---|---|---|
| Pick-success rate | Successful picks divided by pick attempts | Stock records or pick capacity at that node are off |
| Substitution or cancellation rate | Orders substituted or cancelled after the promise, divided by orders accepted | Promises exceed the stock that can be reliably picked |
| Incremental parcel cost | Extra shipping cost from fallback routing against the primary node | Fallback routing is firing too often |
| Order-cycle time | Hours from order placement to dispatch | Pick queues or routing delays are building |
Each signal has a different fix. A falling pick-success rate calls for a cycle count and tighter receiving checks at the affected node, not a new promise. A rising substitution rate means the promise window is too tight for the stock certainty you have, so widen it or lower the advertised ATP. Incremental parcel cost climbing tells you the fallback threshold is set too aggressively and the router is bouncing orders that would have picked fine. Order-cycle time stretching points at queue depth: add a picker to that node's online queue or move the cut-off earlier.
The promise rule: a delivery date is a commitment about the shelf, not about the database.
The evidence supports a narrow rule. Promise only what can be reliably picked, not the maximum geographic coverage the network appears to offer on a map. Coverage that converts to cancellations isn't reach.
More online volume does not, by itself, raise cases picked per labor hour. A large UK grocery retailer gave researchers a nine-year view of the back end, and the labor result runs against the usual utilization story: a single shared inventory pool looks fuller, then costs more picker time per case.
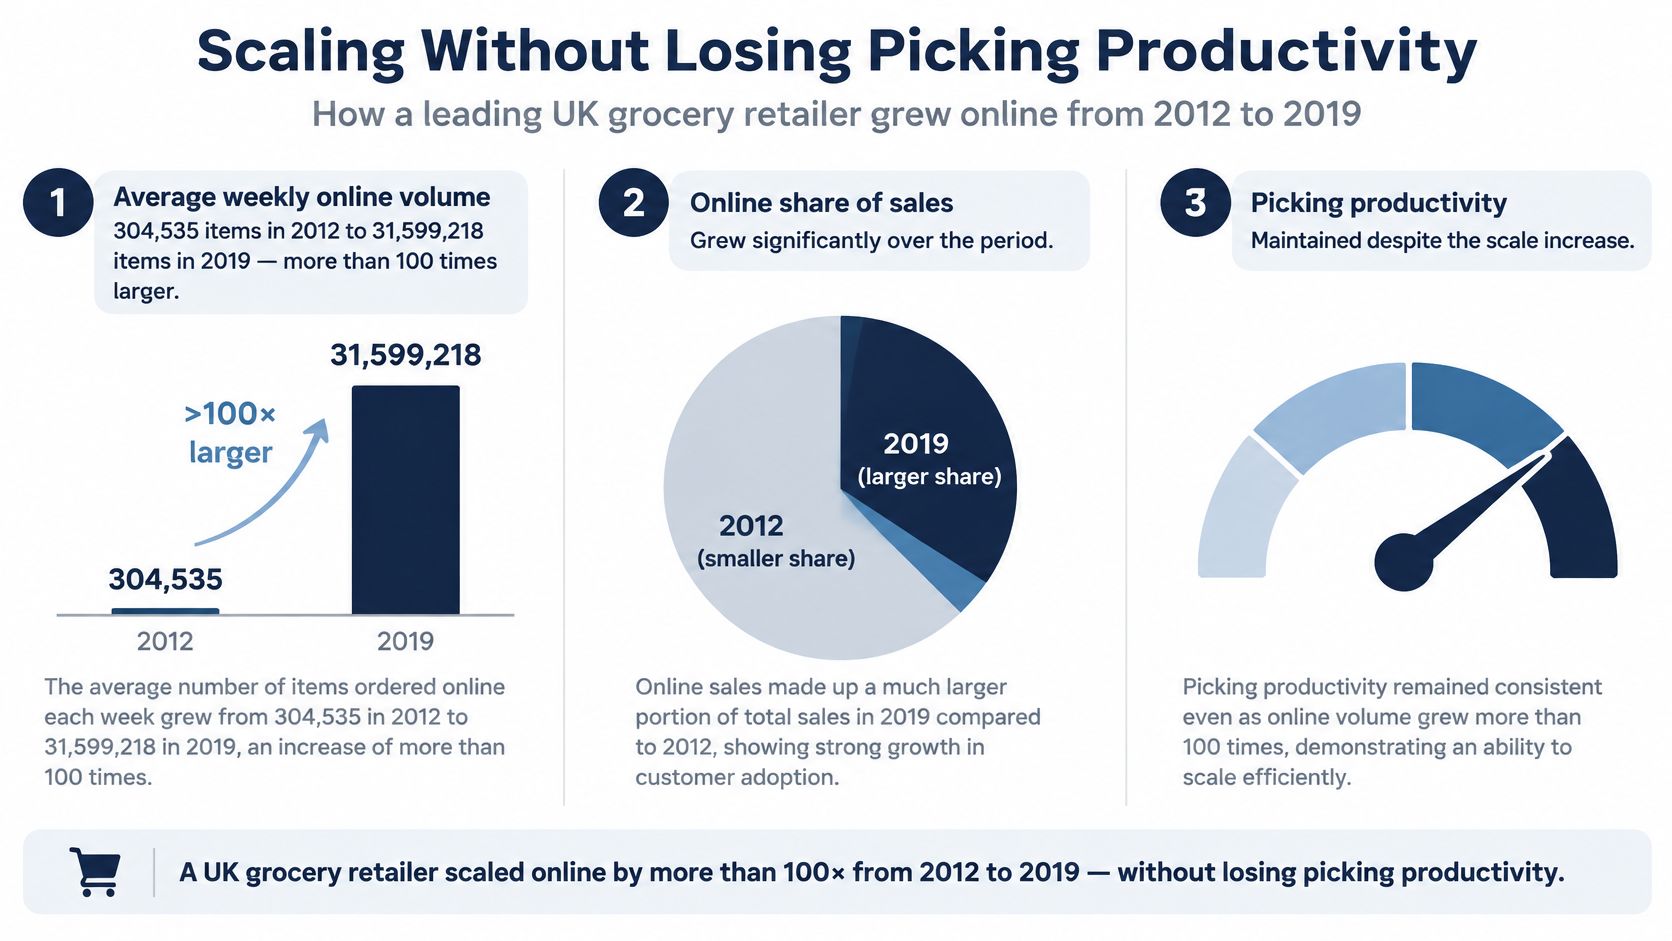
Between January 2012 and December 2019, average weekly online grocery volume rose from 304,535 items to 31,599,218 items, more than a hundredfold increase, while online sales moved from 4.83% to 10.14% of ambient grocery sales and from 2.67% to 8.15% of chilled sales, according to the Journal of Operations Management study.
| Metric | January 2012 | December 2019 |
|---|---|---|
| Average weekly online grocery items | 304,535 | 31,599,218 |
| Online share of ambient grocery sales | 4.83% | 10.14% |
| Online share of chilled grocery sales | 2.67% | 8.15% |
The study found that increased online volume was associated with lower cases picked per labor hour. Sales mix improved on the online line. Picking productivity moved the other way.
A restaurant that adds a delivery menu without adding prep stations serves more meals and slows every plate, because one kitchen now runs two workflows with different timing, packaging and handoff rules. Online grocery picking has the same shape. An online order pulls single units from slots built for case replenishment, so each pick adds travel and touches. Holding both channels in one undifferentiated pool hides that unit-of-measure mismatch until labor hours are already lost.
Three operating moves protect productivity before volume arrives.
Sequencing matters more than any single tool. Capacity planning, inventory accuracy, process redesign and technology investment have to land before the volume does, because after the volume arrives every fix competes with live orders. The systems layer that carries this is the same one covered in this guide to warehouse management systems, configured so online picks are visible as their own workload. Split the pool on purpose, and the case-pick rate has a chance to hold while online volume scales.
Start with a bounded test rather than a network redesign. One SKU group, one month, measured accurately, tells you more than a twelve-month roadmap built on assumed accuracy.
At the first monthly review, three checks decide whether to continue.
Use the outcome to take one of three actions: widen the SKU group, adjust the promise window, or move the fallback threshold. Then repeat.
Practical rule: expand only after pick reliability holds for a full cycle. Growth on an unreliable base multiplies cancellations, not revenue.
The same five steps work whether the brand runs its own warehouse, uses stores as nodes, or leans on third-party marketplace warehouses. The nodes change the cost curves and the promise windows. They don't change the questions. Our community is made up entirely of ecommerce operators, which is why these comparisons get argued out with people who run the same channels rather than general founder groups.
Million Dollar Sellers is an invite-only community where ecommerce founders compare exactly this kind of operating detail, from channel reserve rules to pick-reliability thresholds, with peers running Amazon, DTC and omnichannel brands at seven, eight and nine figures. Membership is built for operators: omnichannel, DTC and TikTok brands need $1M in trailing twelve-month website revenue and a founder or substantial equity holder at the helm. Visit Million Dollar Sellers to see how the group works and whether your numbers fit.
Join the Ecommerce Community for Founders Scaling from 7 to 9 Figures
Learn MoreYou may also like:
Learn more about our events!
Check Events