
Chilat Doina
March 3, 2026
If you're an e-commerce seller, you probably watch your revenue like a hawk. But top-line revenue only tells half the story—the flashy, feel-good half. The other half, the part that actually determines if you’re building a real business or just a busy one, comes down to one number: contribution margin per unit.
This is the exact dollar amount each sale kicks in to help cover your fixed costs (like rent and software) and, eventually, turn a profit. Think of it as the cash "fuel" left in the tank from selling a single product after you’ve paid for all the direct costs of making and selling that one item.

So many founders get caught up in chasing sales volume, but that figure alone says nothing about your actual profitability. Contribution margin cuts right through the noise, showing you the true financial horsepower of every single product you sell.
Honestly, this is the metric that separates healthy, scalable brands from the ones that look busy on the outside but are bleeding cash internally. Nailing this down is your first real step toward mastering your shop's financial health. It’s way more telling than gross margin because it forces you to account for all the little per-sale costs that eat away at your cash flow.
The calculation itself is incredibly simple, but its power comes from knowing exactly what to plug into it.
Contribution Margin per Unit = Sale Price per Unit – All Variable Costs per Unit
This equation gives you a crystal-clear signal on your unit economics. At its heart, it answers one simple question: "After paying for everything required to make and sell one item, how much cash is left to help pay our bills and build our profit?"
To really get this right, you need to understand the two sides of the equation.
This quick table breaks down the components of the formula. Getting these right is everything.
A high contribution margin means every sale is a solid win, giving you plenty of cash to reinvest. A low or negative number? That's a huge red flag that your business model needs a serious tune-up.
Unlike your fixed costs (think software subscriptions or warehouse rent) which you pay no matter what, variable costs scale directly with your sales volume. Sell one more unit, and these costs go up. Sell one less, and they go down.
For an Amazon FBA or direct-to-consumer (DTC) seller, your variable costs typically include:
Let's say you sell a product for $100 and your total variable costs add up to $40. That leaves you with a $60 contribution margin per unit. Now, imagine you get smarter with your supply chain and knock those variable costs down to $32.50. Your contribution margin jumps to $67.50 per unit—that’s a 12.5% boost in per-unit profitability without ever touching your price.
This is exactly why smart, scaling sellers are so obsessed with optimizing their variable costs. As experts from the Corporate Finance Institute point out, operational efficiency is the bedrock of profitability. Every dollar you shave off your variable costs is a dollar that goes straight toward strengthening your business.

Knowing what contribution margin is great, but the real magic happens when you calculate it for your own products. This isn't just a math problem for your accountant; it's how you get a clear look at your business's financial engine.
Let's walk through the numbers step-by-step. We'll ditch the theory and get practical with an example any DTC seller can relate to—a skincare product—so you can see exactly how to tally up every last cost.
This is the easy part. Your sale price per unit is simply what your customer pays for a single item, not including any sales tax.
For our example, let's pretend you're selling a "Glow Up Vitamin C Serum" on your Shopify store for $50.00. That's our starting point.
Pay close attention here, because this is where a lot of e-commerce brands get it wrong. You need to pin down every single cost that pops up only when you sell a unit. If you have to pay for something whether you sell one item or a thousand, it's a fixed cost and doesn't belong in this calculation.
Let's break down the variable costs for our $50 serum:
Now, just add them all together to find your total variable cost.
Total Variable Costs = $8.00 (COGS) + $1.75 (Processing) + $7.50 (Fulfillment) + $10.00 (CAC) = $27.25
Getting your product costs right is non-negotiable. For a closer look at this, check out our guide on how to calculate product costs.
With your sale price and variable costs locked in, the last step is simple subtraction. We're just plugging our numbers into the formula we talked about earlier.
Contribution Margin per Unit = Sale Price per Unit – Total Variable Costs per Unit
For our serum:
$50.00 – $27.25 = $22.75
That $22.75 is your contribution margin per unit. It’s the actual cash each sale of your Vitamin C serum generates to start paying down your fixed costs—things like rent, salaries, and software subscriptions.
This single number is the bedrock of your financial strategy. It tells you exactly how much fuel each product is adding to your business. Knowing this lets you make smarter calls on pricing, marketing spend, and your overall product lineup, turning fuzzy financial goals into hard data you can actually use.
Sooner or later, every founder asks the big question: "How many units do I actually need to sell just to cover my costs?" Knowing your contribution margin per unit is what turns that vague worry into a concrete, monthly sales target.
This is where your unit economics really start to work for you. By understanding the cash each sale kicks back, you can calculate your break-even point—the exact sales volume where your total revenue finally catches up to your total costs. Until you hit that number, you're in the red. The moment you pass it, every single sale starts generating pure profit.
Figuring out your break-even point is refreshingly simple. It’s all about connecting your fixed business costs to the profitability of each individual product you sell.
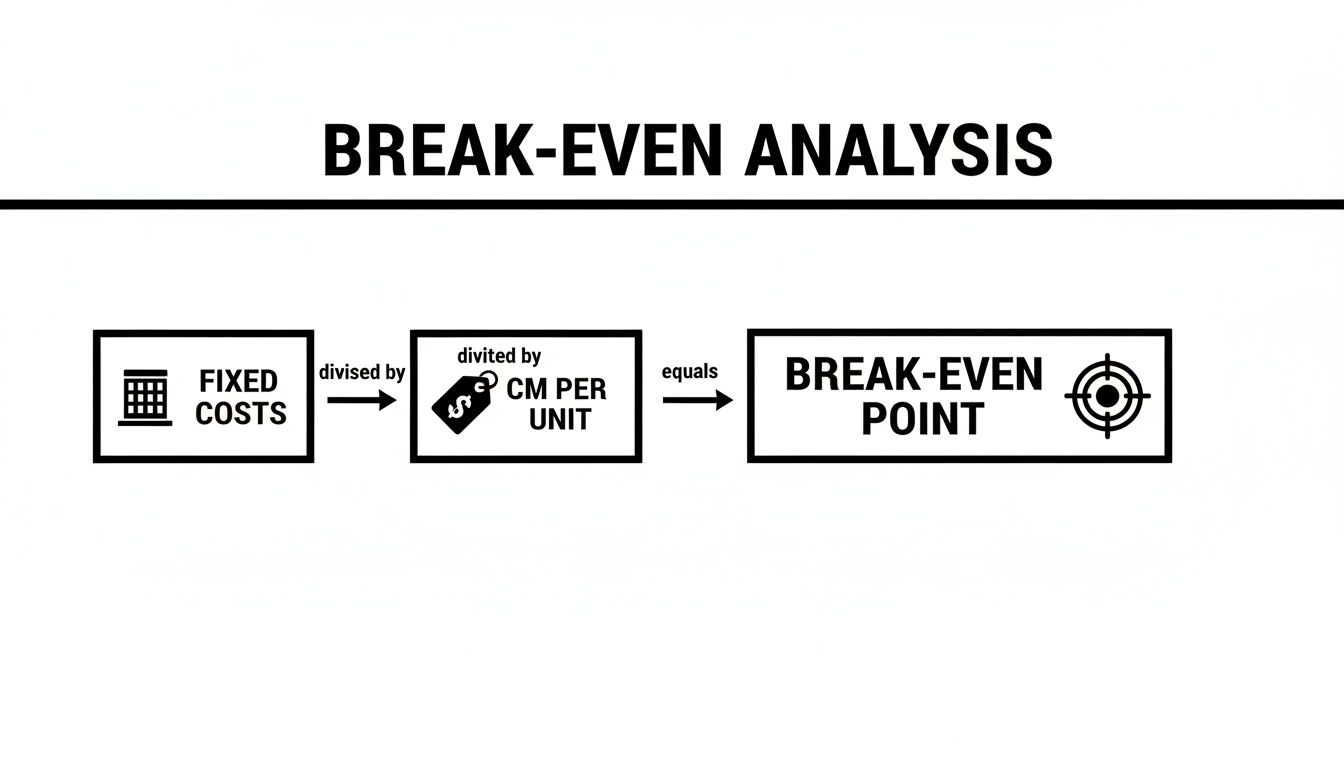
Break-Even Point in Units = Total Fixed Costs / Contribution Margin per Unit
This formula spits out the precise number of products you have to sell in a set period (usually a month) to pay for all your fixed expenses. Let's dig into what goes into it.
Fixed costs are the bills you have to pay no matter what. Whether you sell one unit or ten thousand, these expenses are always there. For a standard ecommerce business, this usually includes:
These are the costs that your contribution margin is chipping away at with every single sale.
Let’s go back to our "Glow Up Vitamin C Serum" example. We've already figured out it has a contribution margin per unit of $22.75.
Now, let's say your total fixed costs for the month are $9,100. This covers your marketing manager's salary, software fees, and a small office space.
Plugging this into the formula:
Break-Even Point = $9,100 (Fixed Costs) / $22.75 (Contribution Margin per Unit)
Break-Even Point = 400 units
There it is. You need to sell 400 units of your serum each month just to cover your operational costs. You haven't made a profit yet, but you haven't lost any money either. You’ve officially broken even. You can dive deeper into this in our full guide on how to calculate your break-even point.
This is where it gets fun. What happens when you sell that 401st unit? Since all $9,100 of your fixed costs are now paid off, the entire $22.75 contribution margin from that one sale is pure profit. The same goes for the 402nd unit, the 403rd, and every unit after that.
This snowball effect is exactly why successful founders are obsessed with their unit economics. A healthy contribution margin gets you to your break-even point faster, and it makes your business exponentially more profitable with every sale you make beyond that milestone. This is the key to predictable growth.
It's a mix-up I see all the time, even with seasoned e-commerce sellers: using gross margin and contribution margin as if they’re the same thing. They sound similar, but this common mistake can paint a dangerously false picture of your product's real profitability.
Getting this right isn’t just about acing a business quiz—it's about making smart financial decisions that keep your brand afloat. The entire difference boils down to one simple question: which costs are you actually subtracting from your revenue?
Gross margin gives you a high-level view of how efficiently you're producing your products. Think of it as the money left over after you've paid for the physical item itself.
On the other hand, contribution margin per unit gets to the heart of each sale's cash-generating power. It’s a much more honest metric because it subtracts all the variable costs that go into a sale, not just the cost of making the product. This shows you exactly how much cash each unit sold "contributes" toward paying your fixed operating bills.
Gross Margin is all about production efficiency. It answers: "Are we making this product at a good cost?"
Contribution Margin is all about per-sale profitability. It answers: "How much actual cash does this sale put in our pocket to pay the bills?"
The contribution margin is the engine that gets you to your break-even point. Every dollar of contribution margin from a sale goes directly toward chipping away at your fixed costs until you finally hit profitability.
As you can see, it's the money from each individual sale's contribution that helps you cover rent, software, and salaries, eventually leading to profit.
To really grasp the difference, you have to be crystal clear about which costs go into which bucket. Misclassifying even a single expense can completely throw off your numbers, making you think a product is a winner when it’s actually draining your cash.
This table lays out the core distinctions side-by-side.
The key takeaway is that contribution margin includes a much wider, more realistic set of costs that are directly tied to each sale, especially for an e-commerce business.
Let's run through a real-world scenario. Imagine you're selling a custom-branded coffee mug on Amazon for $25. The cost of the mug from your supplier (your COGS) is $10.
If you only look at gross margin, things look great:
But wait. As an Amazon seller, you know there are way more costs tied to every single sale. Let's factor those in:
Now, let’s calculate the true contribution margin per unit:
That’s a completely different story. Your contribution margin is just $2.75 per unit. This translates to a tiny 11% contribution margin ratio ($2.75 / $25).
While the gross margin made the product seem like a cash cow, the contribution margin reveals the hard truth: each sale is only generating a couple of bucks to help you pay for software, storage fees, or your own salary. Relying on gross margin alone would have hidden this fatal flaw. For a deeper dive into this ratio, check out our guide on the contribution margin ratio.
Figuring out your contribution margin isn't just a math problem for your accountant. It's the moment you finally see which products are actually making you money and which are secretly draining your bank account.
Once you have this number for each product, you can stop guessing and start making strategic moves with your pricing, marketing, and even which products you decide to keep or cut. Let’s walk through how to put this powerful metric to work.
Ever wonder if a discount will kill your profits? Or if a tiny price increase is worth the risk? Your contribution margin gives you the answer by setting a hard, non-negotiable price floor for every single item you sell.
Simply put, your price must cover your variable costs.
Think of it this way: if a product costs you $30 in variable expenses, selling it for $29.99 means you are literally paying customers to take it off your hands. Any price above $30 starts generating cash to cover your fixed costs (like rent and salaries) and eventually, your profit.
This is critical when you’re planning sales. A 10% discount might sound harmless, but if your contribution margin is only 15%, you just vaporized two-thirds of the cash that sale was supposed to bring in. Knowing your margin lets you see the real impact of discounts before you launch them.
Let's be honest, not all your products are winners. Some are rock stars, and others are just taking up space. A sales mix analysis using contribution margin gives you a crystal-clear view of your catalog, helping you sort every SKU into a few key groups.
You just need to look at two things for each product: its contribution margin and its sales volume.
Stars (High Margin, High Volume): These are your cash cows. They make you a lot of money on every sale and they sell like crazy. Your job is to protect them, promote them, and never, ever let them go out of stock.
Opportunities (High Margin, Low Volume): These products are great profit-makers per unit, but they just aren't moving. You need to figure out why. Is it poor marketing? Bad product placement? This is where you should focus your ad spend to try and turn them into Stars.
Question Marks (Low Margin, High Volume): These products fly off the shelves but don't add much cash to the bank with each sale. Can you raise the price without tanking sales? Could you find a cheaper supplier to lower your variable costs? They need a game plan to become more profitable.
Drains (Low or Negative Margin): These are the products that are either losing you money or barely breaking even. Unless you're using them as a loss leader for a specific strategy, it's probably time to think about discontinuing them.
Categorizing your products like this gives you an immediate action plan. You know exactly where to focus your time and money to get the biggest bang for your buck.
This is one of the most powerful ways to use contribution margin. It tells you exactly how much you can afford to spend to get a new customer—your maximum allowable customer acquisition cost (CAC). This ensures your marketing dollars are profitable from the very first purchase.
The logic is simple: you can't spend more to get a customer than the cash their first purchase gives you.
Maximum Allowable CAC = Contribution Margin per Unit
So, if your "Glow Up Vitamin C Serum" has a contribution margin of $22.75, you know you can spend up to that amount on Google or Meta ads to acquire a single sale and still break even on that order. Any CAC below $22.75 means you made a profit right away.
This simple calculation gives your marketing team a clear, data-driven budget. It directly links ad spend to unit-level profitability, turning your marketing from a confusing expense into a predictable profit engine. Using a customer acquisition cost calculator can give you an even more detailed look at how your ads are performing.
By using the what is contribution margin per unit formula to guide these three areas—pricing, portfolio management, and marketing—you'll shift from just selling things online to building a truly resilient and profitable business.
Once you start digging into your contribution margin, you'll find it raises a lot of practical questions. It's one thing to know the formula, but it's another to know how to act on what it tells you in the messy reality of running an e-commerce business.
Let's walk through some of the most common questions we see from founders. Getting a handle on these scenarios is where the real value of this metric comes to life, giving you the confidence to make smarter financial decisions.
This is a code-red, all-hands-on-deck problem. A negative contribution margin means every time you sell that product, you are actively losing money. You're literally paying your customers to take your inventory off your hands.
This isn't a "wait and see" situation—you have to fix it, and you have to fix it now. Selling more units won't dig you out of the hole; it will just make you lose money faster. If you find a product in this spot, you've got three real options:
The one tiny exception is a "loss leader" strategy, where you intentionally sell at a loss to bring in customers who then buy other, highly profitable items. This is playing with fire, and it demands ruthless tracking to make sure it's actually working the way you planned.
For any e-commerce brand, your costs are a moving target. Supplier prices go up, shipping carriers adjust their rates, and platform fees can change overnight. Because of this, you can't treat contribution margin as a "set it and forget it" metric.
As a rule of thumb, you should be recalculating your contribution margin per unit quarterly. But more importantly, you need to re-run the numbers anytime a major cost changes.
For example, if your 3PL sends an email saying pick-and-pack fees are jumping by $0.50 per order, you need to update your numbers that day. Same goes for when you negotiate a better price with your supplier or when UPS and FedEx announce their annual rate hikes. Staying on top of these shifts means your decisions are always based on the current financial reality, not on last quarter's old data.
Yes, it absolutely does—and this is where you can start to get really strategic with your profitability. When you sell products as a bundle, you simply treat the entire bundle as a single product for the calculation.
Here's the breakdown:
This is such a powerful move because you can find huge savings on your variable costs. You're paying for shipping and fulfillment just once for the bundle, not multiple times for each item if they were sold separately. That efficiency gain can send your contribution margin soaring, making bundles a brilliant way to boost your overall profit.
This is exactly the kind of strategic thinking that happens every day in the Million Dollar Sellers community. Our members are all top-tier e-commerce founders who regularly share deep insights on unit economics, SKU analysis, and cost optimization to help each other scale smarter. If you're an established seller ready to join a network of peers operating at the highest level, see if MDS is the right fit for you.
Join the Ecom Entrepreneur Community for Vetted 7-9 Figure Ecommerce Founders
Learn MoreYou may also like:
Learn more about our special events!
Check Events