
Chilat Doina
February 24, 2026
Here's the simple formula to calculate your customer retention rate: [(Ending Customers - New Customers) / Starting Customers] x 100.
This little calculation gives you the percentage of customers you've successfully kept over a set period. It's a powerful snapshot of your brand's health and customer loyalty.

Before we get buried in spreadsheets, let's get one thing straight: for any serious ecommerce founder, customer retention isn't just another metric. It's the metric.
Chasing new customers always feels exciting, but the real, long-term growth for any DTC or Amazon brand is built on repeat business. It's that simple.
So many entrepreneurs get stuck in the "leaky bucket" trap. They burn cash on ads to pour new customers in, only to watch them drain right out after a single purchase. Mastering retention means plugging those leaks. It's the difference between a business that needs a constant, expensive IV drip of new leads and one that builds its own momentum.
Think about it—the cost of digital ads just keeps climbing. Your customer acquisition cost (CAC) is a relentless beast that chews through your margins.
The data doesn't lie: acquiring a new customer is anywhere from five to 25 times more expensive than keeping an existing one. When you nail your retention strategy, you fundamentally change the financial DNA of your business.
Here's how a solid retention game impacts your bottom line:
By shifting from a pure acquisition mindset to a retention-first one, you're not just saving a few bucks. You're building a more resilient, profitable business. This is a core pillar of solid unit economics that separates the struggling brands from the seven- and eight-figure powerhouses.
Beyond the numbers, your most loyal customers are your single greatest source of feedback. They're the ones who get your product and can offer insights a first-time buyer never could.
These repeat customers will tell you exactly what they love, what they wish you offered, and where you're dropping the ball. That direct line of communication is a massive competitive advantage.
It lets you fine-tune your products and marketing with real-world data, ensuring you’re building something that truly connects with your audience. At the end of the day, retention isn't just math—it's about building a defensible brand that your customers would hate to leave.
Alright, let's get our hands dirty with the numbers.
The good news? You don't need a math PhD to figure out your baseline customer retention rate. It's a surprisingly simple calculation that gives you a powerful, at-a-glance snapshot of how well you're keeping customers around.
First things first, you need to pick a time frame. For fast-moving DTC brands, I’ve found that tracking this monthly or quarterly usually hits the sweet spot. A monthly check gives you a quick pulse on things, while a quarterly view smooths out any weird single-month blips and lets you see the bigger picture.
Unless you're selling something people buy constantly, I'd steer clear of weekly tracking. It just creates a lot of noise.
Once you’ve settled on a period, you just need to grab three pieces of data. Let's make it real.
Imagine you run a DTC supplement brand and you’re reviewing your first quarter (Q1). To nail down your retention rate, you’ll need to find:
Got those three numbers? Perfect. That’s everything you need for the standard formula.
The classic CRR formula has become the gold standard for a reason. It's a clean, direct way to measure how sticky your brand is over time.
The formula is [(E – N)/S] × 100, and it's built on the three data points we just gathered. Let's quickly break down what each part means and why it's so important.
.tbl-scroll{contain:inline-size;overflow-x:auto;-webkit-overflow-scrolling:touch}.tbl-scroll table{min-width:600px;width:100%;border-collapse:collapse;margin-bottom:20px}.tbl-scroll th{border:1px solid #ddd;padding:8px;text-align:left;background-color:#f2f2f2;white-space:nowrap}.tbl-scroll td{border:1px solid #ddd;padding:8px;text-align:left}VariableRepresentsExample Value (DTC Brand - Q1)Why It MattersEEnding Customers11,500This is your total customer count at the end of the period. It reflects both retained and newly acquired customers.NNew Customers2,500These are the customers you acquired during the period. They must be subtracted to isolate your original customer group.SStarting Customers10,000Your baseline. This is the pool of customers you're measuring your retention against.
This table shows how each piece of the puzzle fits together. The most common mistake is forgetting to subtract the new customers (N), which completely skews the result. You can get more background on this fundamental e-commerce metric from the folks at Gainsight.
Now, let's plug our DTC brand's numbers into the formula to see it in action:
Here’s the calculation:
[(11,500 - 2,500) / 10,000] x 100
First, you subtract the new customers from your ending total. This is the magic step that isolates the customers who were with you from the very beginning.
11,500 - 2,500 = 9,000
That 9,000 represents the customers you successfully held onto from your initial pool of 10,000.
Next, divide that number by your starting customer count to see what percentage of the original group stuck around.
9,000 / 10,000 = 0.90
And finally, multiply by 100 to turn it into a percentage we can all understand.
0.90 x 100 = 90%
Boom. Your customer retention rate for Q1 is 90%. This tells you that for every 10 customers you had at the start of the year, you kept 9 of them. That's a solid number.
Key Takeaway: I can't stress this enough: subtracting your new customers is the most crucial part of this calculation. If you skip that step, you're not measuring retention at all—you're just looking at overall customer growth. True retention is all about how well you hang on to the people you already won over.
One last thing, but it’s a big one: data integrity. This whole calculation is only as good as the numbers you put into it. "Dirty" data can give you a false sense of security or, even worse, send you on a wild goose chase trying to fix problems that don't actually exist.
Before you start pulling numbers, get your team aligned on what a "customer" is. Is it someone with an account? What about guest checkouts? Whatever you decide, be consistent. If you do include guests, make sure you have a system to merge their data if they create an account later with the same email.
A clean, well-maintained customer database is the bedrock of any meaningful analysis. Once you have this baseline number nailed down, you can start digging into the really fun stuff—the more advanced metrics that reveal the why behind your customers' behavior.
The simple retention formula is a great starting point. It gives you a single, high-level number that tells you if you're generally keeping customers around. But for operators trying to scale a brand past seven or eight figures, a single number just isn't going to cut it. You need to get your hands dirty and dig into the real story behind that number.
This is where more advanced metrics come into play. They help you move past the basic question of "who stayed?" and start answering the much more valuable questions: "Which customers stayed, and how is their spending changing over time?"
This diagram breaks down the basic calculation, showing how your starting, new, and ending customer counts fit together.
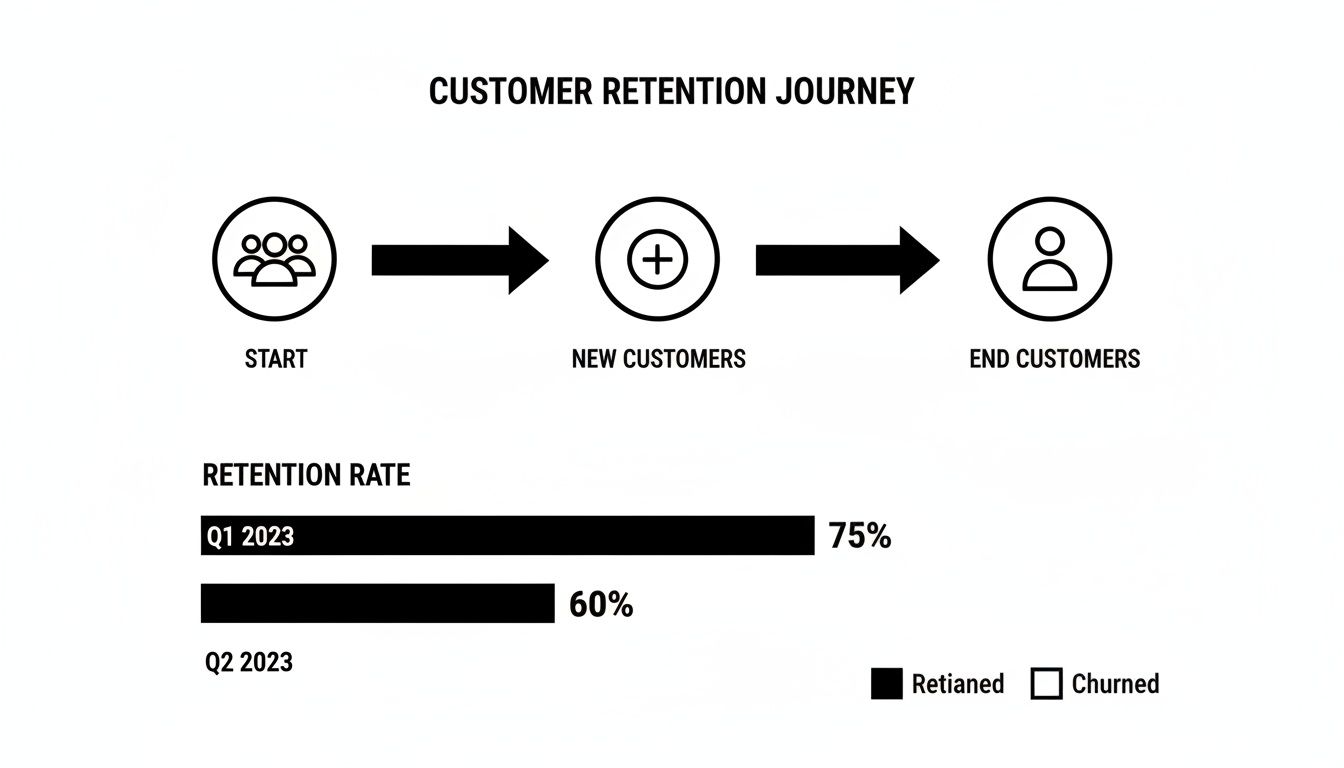
The key takeaway is that you have to subtract new customers from your final count to get an honest look at how many original customers you truly kept. Now, we’re going to build on that by tracking specific customer groups and the revenue they bring in.
Instead of lumping all your customers into one big bucket, cohort analysis groups them based on when they made their first purchase. Think of it like a graduating class. You can create a "January 2024 New Customer Cohort," a "February 2024 Cohort," and so on.
Tracking each cohort separately lets you see how their loyalty and buying habits evolve month after month. This approach is incredibly powerful for a few reasons:
Cohort analysis turns your retention data from a flat, one-dimensional number into a rich, multi-layered story. It helps you understand not just if you're retaining customers, but how well you're retaining the customers you've acquired recently.
Let's say your "January Cohort" has a 6-month retention rate of 25%, but your "June Cohort" shows a 6-month retention of 35%. That’s a huge win! It's concrete proof that whatever changes you made between January and June are building a stickier customer experience. This is the kind of insight that justifies marketing spend and guides your entire strategy.
While cohort analysis tracks groups of people, Net Revenue Retention (NRR) tracks their dollars. This metric is a game-changer, especially for brands with subscription models or strong upsell and cross-sell potential.
NRR measures the total recurring revenue from a group of existing customers over a period, factoring in both churn (lost revenue) and expansion revenue (upgrades, add-ons, etc.). It answers the critical question: "Are my existing customers, as a group, spending more or less with me over time?"
The formula looks like this:
[(Starting MRR + Expansion MRR - Churn MRR) / Starting MRR] x 100
Here’s where it gets really exciting. Your NRR can actually go above 100%.
An NRR over 100% means the new revenue you're generating from existing customers is greater than the revenue you're losing from customers who churn. This is the hallmark of a healthy, scalable business. It’s often called "negative churn" on a revenue basis, and it’s a powerful growth engine.
For DTC brands, this could look like:
Understanding NRR is critical because it's directly tied to profitability. It proves your brand is not just keeping customers, but actively increasing their value over time. While you’re focused on your retention rate, you should also learn more about its inverse metric by checking out our guide on how to calculate customer churn rate. It provides another essential perspective on your business's health.
Knowing the formulas for customer retention is one thing, but getting a number you can actually trust is a whole different ball game. A flawed calculation can be worse than none at all—it can send you chasing phantom problems or give you a false sense of security while your business is leaking customers.
Getting this right means sidestepping a few common traps that even seasoned brand owners fall into. These mistakes quietly skew your data, leading to misguided strategies that burn through time and cash. Let's walk through them.
One of the biggest culprits of bad retention data is a simple one: "dirty" or inconsistent customer information. For any ecommerce brand, this usually starts with the classic guest checkout vs. registered account headache.
Think about it. If your system logs a guest purchase from an email address and then a new registered account from that same email address, it often counts them as two separate people. Suddenly, your data is compromised. You think you have more new customers and lower retention than you actually do.
The fix starts with establishing a single source of truth for what a "customer" is.
Clean, consistent data is the bedrock of any reliable retention metric. Without it, you’re flying blind.
The time frame you pick for your calculation dramatically changes the story your numbers tell. A weekly retention report might be perfect for a brand selling daily-use consumables, but it's completely useless for a company selling mattresses or high-end furniture.
A customer isn't "churned" from your mattress brand if they don't buy another one a month later—that’s just the natural buying cycle. Measuring retention over a period that doesn’t match how people actually use your product will give you a misleadingly low number that causes unnecessary panic.
Selecting the right time frame is more art than science. It requires you to honestly assess your product's natural buying frequency. For most DTC brands, monthly or quarterly tracking provides a balanced view that smooths out short-term noise while still being actionable.
Be realistic about your business. A coffee subscription brand might track retention monthly. A luxury watch company should probably be looking at it annually. Your measurement period has to align with your customer’s reality to be meaningful.
If you sell primarily on Amazon, calculating a true customer retention rate gets even trickier. Amazon’s platform is built to protect customer privacy, which means you don't get the direct, individual-level data you need for the standard formulas.
But you're not completely in the dark. You just have to use the tools Amazon gives you to get a strong directional sense of your repeat business.
While you can't plug these numbers directly into the standard retention formula, you can track the repeat purchase rate as a powerful proxy. If that rate is climbing, you know your retention efforts are paying off.
Keeping your focus on retention is non-negotiable for serious sellers, especially when you look at the economics. It can cost up to 700% less to keep an existing customer than to acquire a new one. That's a staggering figure that should fundamentally change how you think about your marketing budget. You can find more on this critical cost difference and its impact on your bottom line in this detailed analysis.

Okay, so you know how to calculate your retention rate. That’s the first step. The real work—and the real money—is in making that number climb.
Improving retention isn’t about vague advice like "offer great service." For modern e-commerce brands, it’s about engineering specific, measurable actions that build relationships and make customers want to come back. It's about turning one-time buyers into loyal advocates.
Let's dive into the strategies that actually move the needle.
One of the most powerful ways to boost retention is to gamify it. A tiered loyalty program does more than just give out points; it creates a clear path for customers to unlock better and better perks, giving them a real reason to stick around.
It's way more engaging than a flat "earn points" system. Customers can see the next level and know exactly what they need to do to get there.
This structure builds a sense of progression and exclusivity. It makes your most valuable customers feel like insiders, and that's a feeling they won't get from your competitors.
The time immediately after a customer’s first purchase is your single biggest opportunity to secure the second one. Their excitement is at its peak, and your brand is top-of-mind. A strategic post-purchase email automation is non-negotiable for any serious DTC brand.
This isn't just about a shipping confirmation. It’s a carefully crafted sequence designed to build a real relationship.
A well-designed post-purchase flow does more than just sell; it onboard a customer into your brand's world. It reassures them they made a smart choice and subtly guides them toward becoming a repeat buyer.
If you sell products people use up and reorder—think coffee, supplements, or skincare—a subscription model is the ultimate retention machine. It completely automates the repeat purchase, locking in future revenue and massively increasing your customer lifetime value.
To see just how powerful this is, check out our deep dive on customer lifetime value calculation.
Subscriptions take all the friction out of reordering for the customer. They never have to remember to stock up, and you can sweeten the deal with a small discount (like 10% off) for subscribing. It instantly turns a one-off transaction into a long-term relationship.
Your existing customers are your most valuable R&D department. They’re the ones using your products day-in and day-out, and their insights are pure gold. Actively asking for and acting on their feedback is a retention strategy that many brands overlook.
When customers see you making changes based on their suggestions, it builds incredible trust and loyalty. It proves you're listening and shows them they have a real stake in your brand’s journey.
You can find a structured way to manage these relationships by exploring different client relationship management strategies.
Choosing the right retention strategy depends on your specific goals and resources. Here's a quick breakdown of how these tactics stack up against common e-commerce objectives.
.tbl-scroll{contain:inline-size;overflow-x:auto;-webkit-overflow-scrolling:touch}.tbl-scroll table{min-width:600px;width:100%;border-collapse:collapse;margin-bottom:20px}.tbl-scroll th{border:1px solid #ddd;padding:8px;text-align:left;background-color:#f2f2f2;white-space:nowrap}.tbl-scroll td{border:1px solid #ddd;padding:8px;text-align:left}StrategyPrimary GoalBest ForImplementation EffortTiered Loyalty ProgramIncrease Purchase FrequencyBrands with a wide product catalogHighPost-Purchase EmailsSecure the Second PurchaseAll e-commerce brands, especially new onesMediumSubscription ModelAutomate Recurring RevenueBrands selling consumable productsHighCustomer Feedback LoopImprove Product & TrustBrands focused on product quality & communityLow to Medium
By tying these specific tactics to your goals, you can start making a real difference in your numbers. Each strategy reinforces the value of staying with your brand, helping you build a loyal customer base that powers sustainable, long-term growth.
Once you get a handle on the formulas for customer retention, a whole new set of questions always seems to pop up. Moving from the "how" to the "what does this actually mean for my business" is where the real work begins.
This is all about turning those numbers into smart decisions. Let's dig into a few of the most common questions I hear from brands after they've run the numbers for the first time.
This is the million-dollar question, isn't it? And the honest answer is: it depends. There's just no magic number that works for every brand out there. What's considered "good" for a daily supplement company would be a total disaster for a brand selling high-end furniture that people buy once every five years.
But we're not flying blind. Industry benchmarks give us a solid starting point to see where we stand.
The most important benchmark is your own history. Are you getting better? Is your retention rate ticking up month-over-month or quarter-over-quarter? That's the real sign of a healthy, growing brand.
Figuring out the right frequency here is all about matching it to your customers' natural buying cycle. If you get this wrong, you'll be looking at noisy data that could send you down the wrong path.
For most DTC brands, calculating this on a monthly or quarterly basis is the sweet spot. A monthly check-in is like a quick pulse check—it shows you the immediate impact of recent marketing campaigns. A quarterly review, on the other hand, gives you a more stable, big-picture view by smoothing out any random ups and downs.
Honestly, weekly tracking is probably overkill unless you're selling something people buy constantly, like coffee pods or meal kits.
If you're an Amazon-exclusive seller, you've probably already hit this wall. Calculating a true customer retention rate is nearly impossible because Amazon guards individual customer data like Fort Knox. You can't track a specific person over time.
But you're not completely in the dark. You can use a fantastic proxy metric: the Repeat Purchase Rate.
You can find this right in your Amazon Brand Analytics dashboard. It shows you what percentage of your orders came from repeat customers versus first-timers. While it's not the same as true retention, tracking this percentage gives you a powerful clue about customer loyalty. If that repeat purchase rate is climbing, you know your efforts to build a real brand are paying off.
This one is way simpler than it sounds. Retention rate and churn rate are just two sides of the same coin—they're direct opposites.
It's a straightforward relationship. If your customer retention rate for the quarter was 85%, your churn rate was 15%. That's it. Both metrics tell a story about customer loyalty, just from different angles. Knowing both gives you a complete picture of how well you're holding onto the customers you worked so hard to get.
Want to scale your brand with insights from founders who have already done it? In Million Dollar Sellers, you get direct access to the strategies and peer support that 7-, 8-, and 9-figure e-commerce entrepreneurs use to stay ahead. Learn more about joining our exclusive community.
Join the Ecom Entrepreneur Community for Vetted 7-9 Figure Ecommerce Founders
Learn MoreYou may also like:
Learn more about our special events!
Check Events