Chilat Doina
November 6, 2026
Target's stores fulfilled more than 96% of total merchandise sales for the third consecutive year in fiscal 2024, according to its annual report filed with the SEC. That figure reframes the Target omnichannel strategy: the company's digital business depends on physical stores doing the fulfillment work. For ecommerce operators, the important question isn't whether stores can support online growth. It's whether they can do so profitably after picking, staging, handoffs, and service recovery.
Target doesn't operate stores and ecommerce as independent fulfillment businesses. Customers can initiate purchases through different interfaces, but store inventory and store teams support multiple routes to completion.
The distinction that matters is sales origin versus fulfillment location. A digitally originated sale describes where the customer placed the order, not which building supplied the merchandise or which team handled it.
Target's omnichannel indicators, 2022 to 2025
The historical merchandise-sales and store-network figures below come from Target's annual-report disclosures.
| Metric | Reported value | Year |
|---|---|---|
| Store-fulfilled share of merchandise sales | 96.7% | 2022 |
| Store-fulfilled share of merchandise sales | 97.4% | 2023 |
| Store-fulfilled share of merchandise sales | 97.6% | 2024 |
| Total merchandise sales | $104.8 billion | 2024 |
| Store-originated sales | $84.3 billion | 2024 |
| Digitally originated sales | $20.5 billion, about 19.6% | 2024 |
| Digitally originated share of sales | 20.6%, as reported in Target's business disclosure discussed below | 2025 |
| Store base | Nearly 2,000 stores, with 23 opened | 2024 |
The store-fulfillment series describes an operating architecture, not just a shopping preference. Stores supply merchandise for purchases initiated both inside and outside the building. Reading that measure as the proportion of customers shopping in person would misrepresent the model.
The sales split answers a different question: where did customers place their orders? It doesn't establish a separate digital inventory pool, digital labor force, or digital profit center. An ecommerce dashboard can record revenue that a store team must then fulfill.
The store-base row identifies the physical infrastructure behind the proposition. Target uses that network for Order Pickup, Drive Up, delivery, and ship-from-store, rather than reserving stores exclusively for walk-in shopping.
Analyst's distinction: Sales origin tells you where demand entered the business. Fulfillment location tells you where the business had to execute.
For a brand owner, that changes how channel performance should be reviewed. Digital marketing can generate an order, but the website doesn't find the item, reserve a staging location, or complete the handoff.
Target's model is therefore better understood as a store-backed commerce network than as a website attached to a retailer. The storefront is both a commercial asset and an operating responsibility. Neither role should disappear from the financial analysis.
A Target store acts like a shop front and a small warehouse at the same time. Think of a neighborhood library that serves visitors while also finding and sorting reserved books for collection.
Say a customer searches online for household supplies. The customer selects a nearby store, sees available inventory, and chooses Drive Up. A store employee must then locate the merchandise, separate it from stock available to other shoppers, and prepare the order for collection.
The order's journey makes the operating model easier to see.
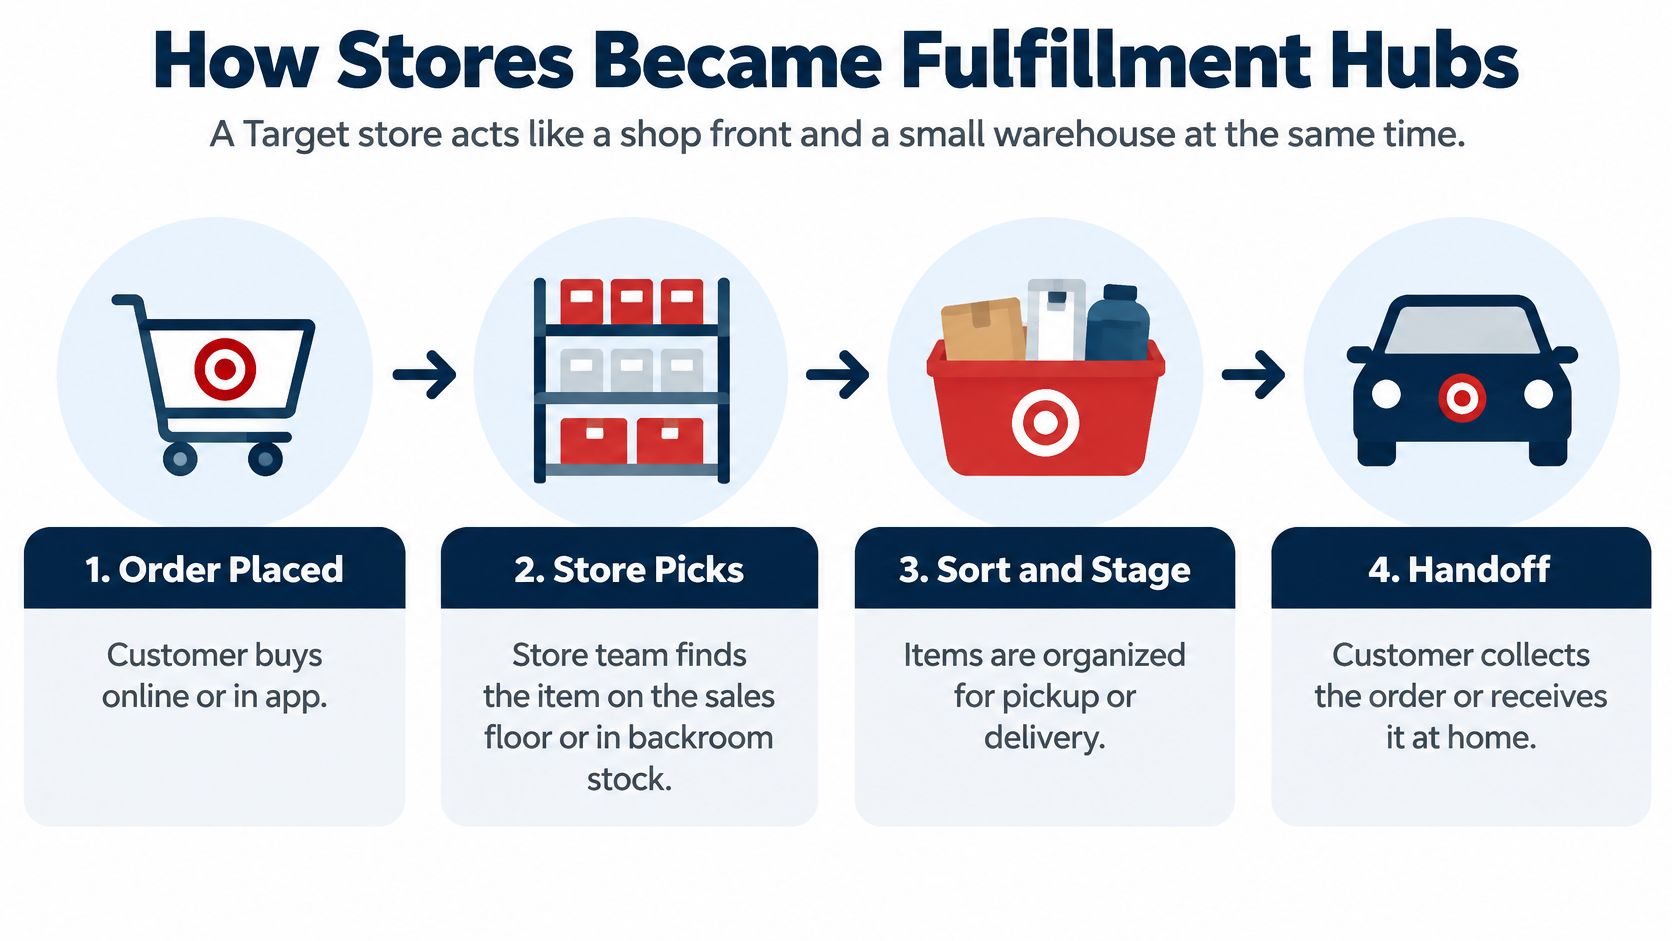
The employee's task doesn't end when the item comes off the shelf. Staff must associate it with the correct order, stage it where colleagues can retrieve it, and update its status before the customer arrives.
For a retailer designing this workflow, distinguish available inventory, reserved inventory, and ready-to-collect inventory. These are different operational states. Treating them as interchangeable can leave the customer with a confirmation that the store can't honor.
Physical layout matters, too. Material Handling USA's resource on storage systems for retail distribution is relevant when evaluating shelving, staging space, and the movement of picked merchandise. Use that planning lens to separate held orders from sellable stock and keep retrieval paths clear.
The systems counterpart is omnichannel inventory management: reservations, cancellations, collections, and returns need to update the inventory position used by every selling channel.
Target's transformation wasn't an emergency response to contactless shopping. According to Target's management discussion of its omnichannel development, same-day options drove more than 70% of comparable digital-sales growth in 2019, before same-day services grew 235% in 2020.
That sequence matters more than the surge alone. Customers were already adopting digital ordering tied to local fulfillment before the pandemic accelerated demand. The practical capability existed before the exceptional growth arrived.
Proximity creates the opportunity: merchandise positioned near customers can avoid a longer parcel journey and support a quicker handoff. But proximity isn't a substitute for execution. An item that's physically nearby but incorrectly recorded as available can still produce a failed order.
The transferable model is discovery online, inventory in store, fulfillment at the curb or door. For an ecommerce brand, building a better website addresses only the entry point. The inventory record and store workflow determine whether the purchase can be completed as promised.
A delivery promise is only useful when its timing is clear. Customers need to know whether the clock refers to order acceptance, readiness for collection, dispatch, or arrival.
Target's 2025 management discussion reports the service coverage and timing measures below. These measures describe different populations, so they shouldn't be combined into a single delivery-speed claim.
Same-day service options and reported performance
| Service | How it works | Reported figure |
|---|---|---|
| Order Pickup | Customer buys online and collects inside the store | Nearly all stores offer it, 2025 |
| Drive Up | Customer collects curbside at a parking space | Nearly all stores offer it, 2025 |
| Same-day delivery | Delivery from store inventory within hours | About 80% arrive within three hours or less |
| Same-day options combined | Pickup, Drive Up, and same-day delivery | About two-thirds of digital sales, 2025 |
| Next-day fulfillment | Order fulfilled within one day through store services | Almost 80% of online orders in a recent quarter |
The final row describes within-one-day fulfillment, not necessarily a distinct next-day shipping product. Likewise, the same-day delivery timing figure doesn't describe every online order.
Curbside collection also requires a separate handoff operation after picking is complete.
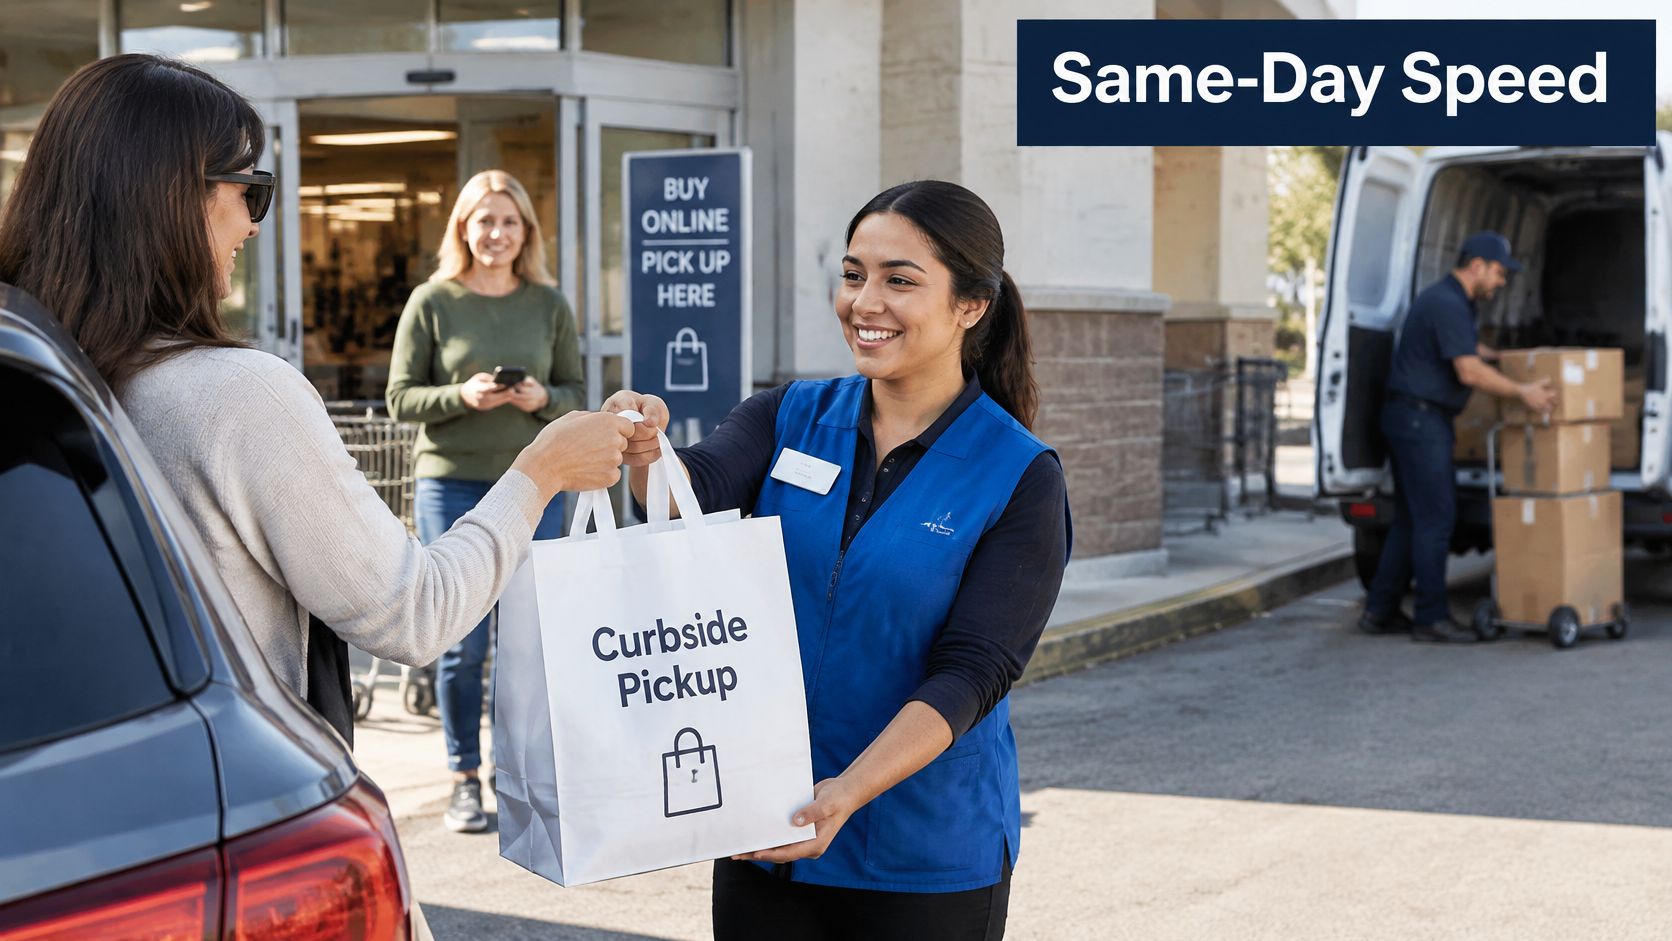
Order Pickup requires staff to prepare an identifiable order and make it retrievable at the collection point. Drive Up adds arrival coordination and an employee trip to the vehicle. Same-day delivery adds a delivery partner's availability, dispatch, and travel time.
To design a comparable service, connect the following operating controls:
Evaluate last-mile delivery solutions against the promise you intend to make, not just the fastest advertised transit time. Dispatching promptly won't rescue an order that spent too long waiting to be picked.
Track promised-window hit rate, inventory accuracy at the assigned location, and contribution margin by fulfillment method. Record timestamps for acceptance, pick completion, readiness, and handoff so the team can identify where delays originate.
A fast promise that staff can't honor at the shelf is a weaker proposition than a slower promise they can reliably keep.
The useful benchmark isn't whether your brand matches Target's headline speed. It's whether the selected service window is operationally repeatable without concealing excessive labor or delivery expense.
A high store-fulfillment rate doesn't prove superior fulfillment economics. It establishes where merchandise was supplied, not how much incremental work each order required.
Target's 2025 business disclosure reports that stores fulfilled more than 97% of merchandise sales in each of the last three years, while digitally originated sales represented 20.6% of 2025 sales. The operational implication is substantial store responsibility, but the disclosure doesn't provide a complete profit-and-loss account for each fulfillment method.
Reducing parcel expense can require additional activity inside the store. Picking, packing, staging, and handoffs aren't free because the building already exists.
The cost categories below identify what an operator should investigate, not quantified losses attributed to Target.
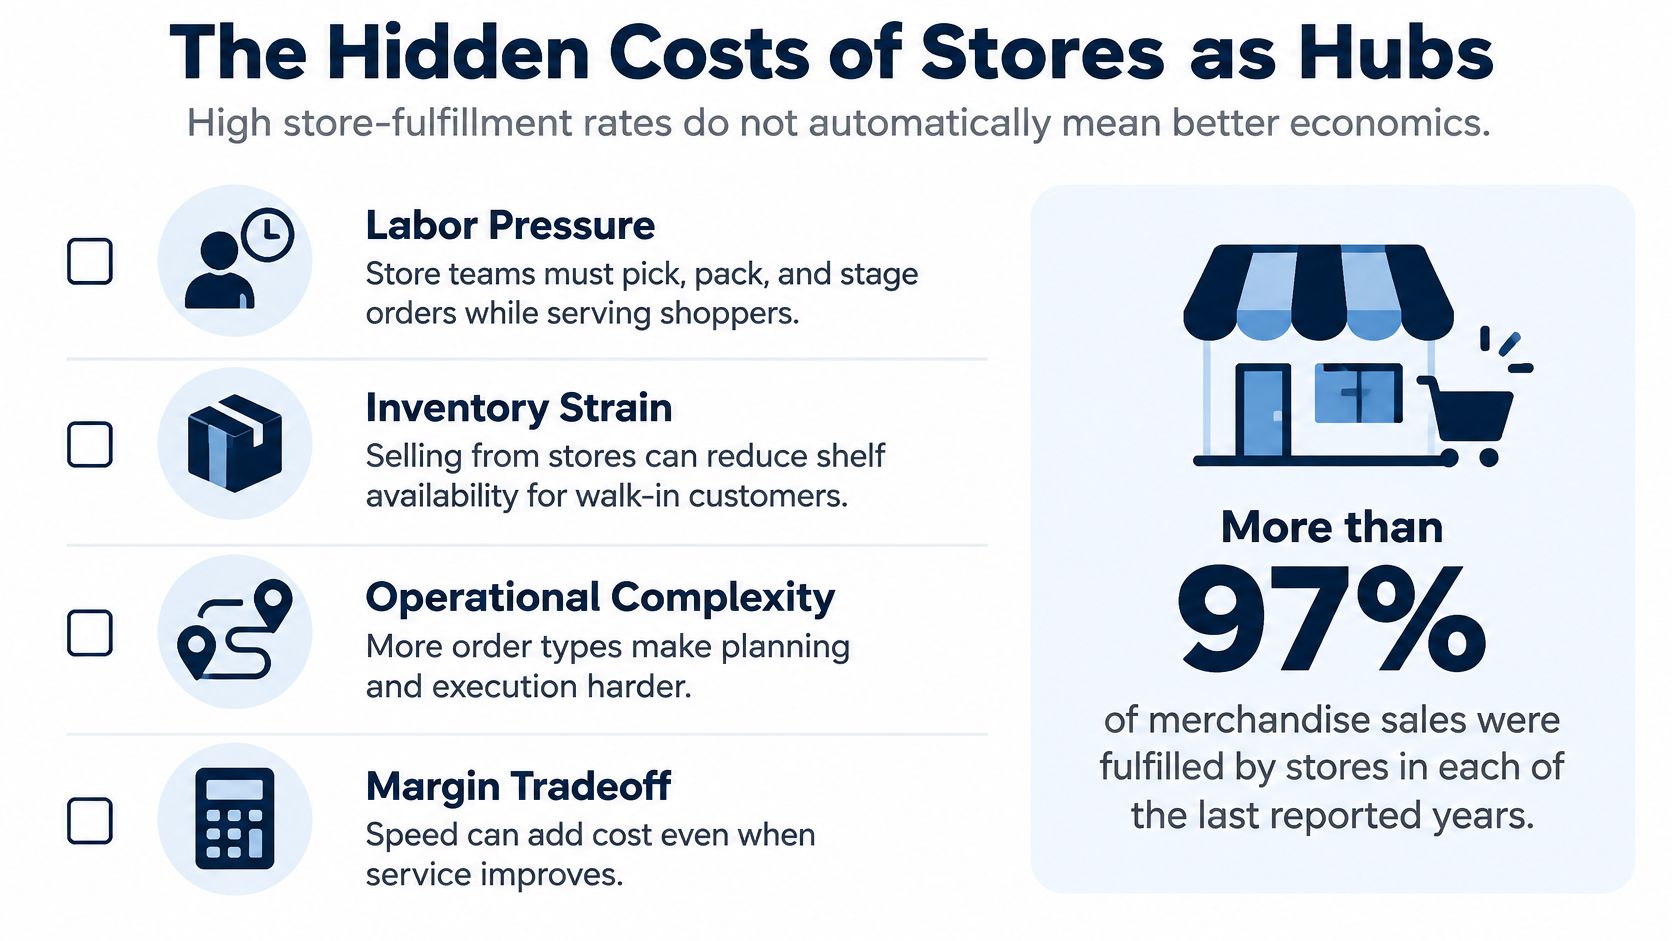
Store fulfillment cost checklist
| Cost line | What to measure |
|---|---|
| Picking labor | Labor minutes per order, with rising search time as a warning sign |
| Pickup-shelf congestion | Peak-hour wait per pickup, including retrieval delays |
| Inventory errors | Failed pickups per 100 orders, separating stock errors from cancellations |
| Shrink on held orders | Held-order loss rate, reconciled against staging records |
| Returns at the counter | Return handling minutes per order, including inspection and restocking |
| Customer-service time | Order-question contacts per 100 orders, classified by cause |
Use paid labor time, not just scheduled headcount. When existing employees absorb fulfillment, the relevant question is what other work they postpone or what additional coverage the store requires.
Avoid treating every store expense as incremental, however. Charging an online order the entire cost of space that would remain occupied anyway can distort the decision in the opposite direction.
For product-level analysis, Arlo Inc.’s guide to compare fulfillment costs by SKU offers a useful starting point. Apply the same discipline to bulky products, low-margin replenishment items, and orders assembled from scattered departments rather than relying on an average basket.
Start with net merchandise revenue and subtract product cost, payment expense, picking and packing labor, packaging, handoff or delivery expense, and expected exception costs. Treat shared overhead separately, then test whether the proposed operation requires additional staffing or space.
A practical unit economics framework should make those assumptions visible. Include the cost of failed pickups through refunds, wasted handling, support contacts, and any redelivery rather than recording the failure only as a service metric.
Decision rule: Route an order to a store when its expected contribution margin and service reliability justify that choice against warehouse fulfillment.
Centralized inventory may be preferable when store picking is difficult, local demand is sparse, or consolidation makes fulfillment simpler. A store may be preferable when eligible merchandise is available and staff can execute the handoff efficiently.
Target's public reporting leaves limited visibility into incremental labor, profitability by method, and variation across formats and markets. The honest conclusion is that the network enables convenience, while its method-level economics remain incompletely disclosed.
Does faster delivery create durable loyalty, or does it merely raise the expense of matching competitors' convenience? Target's growth initiatives make that a capital-allocation question, not just a marketing question.
The bundle combines Circle 360 delivery membership, faster fulfillment, and Target Plus, its third-party marketplace. The intended logic is understandable: membership encourages repeat use, delivery reduces waiting, and marketplace assortment broadens what customers can find.
The doorstep handoff is the customer-facing outcome, but it doesn't reveal the subsidy behind the service.
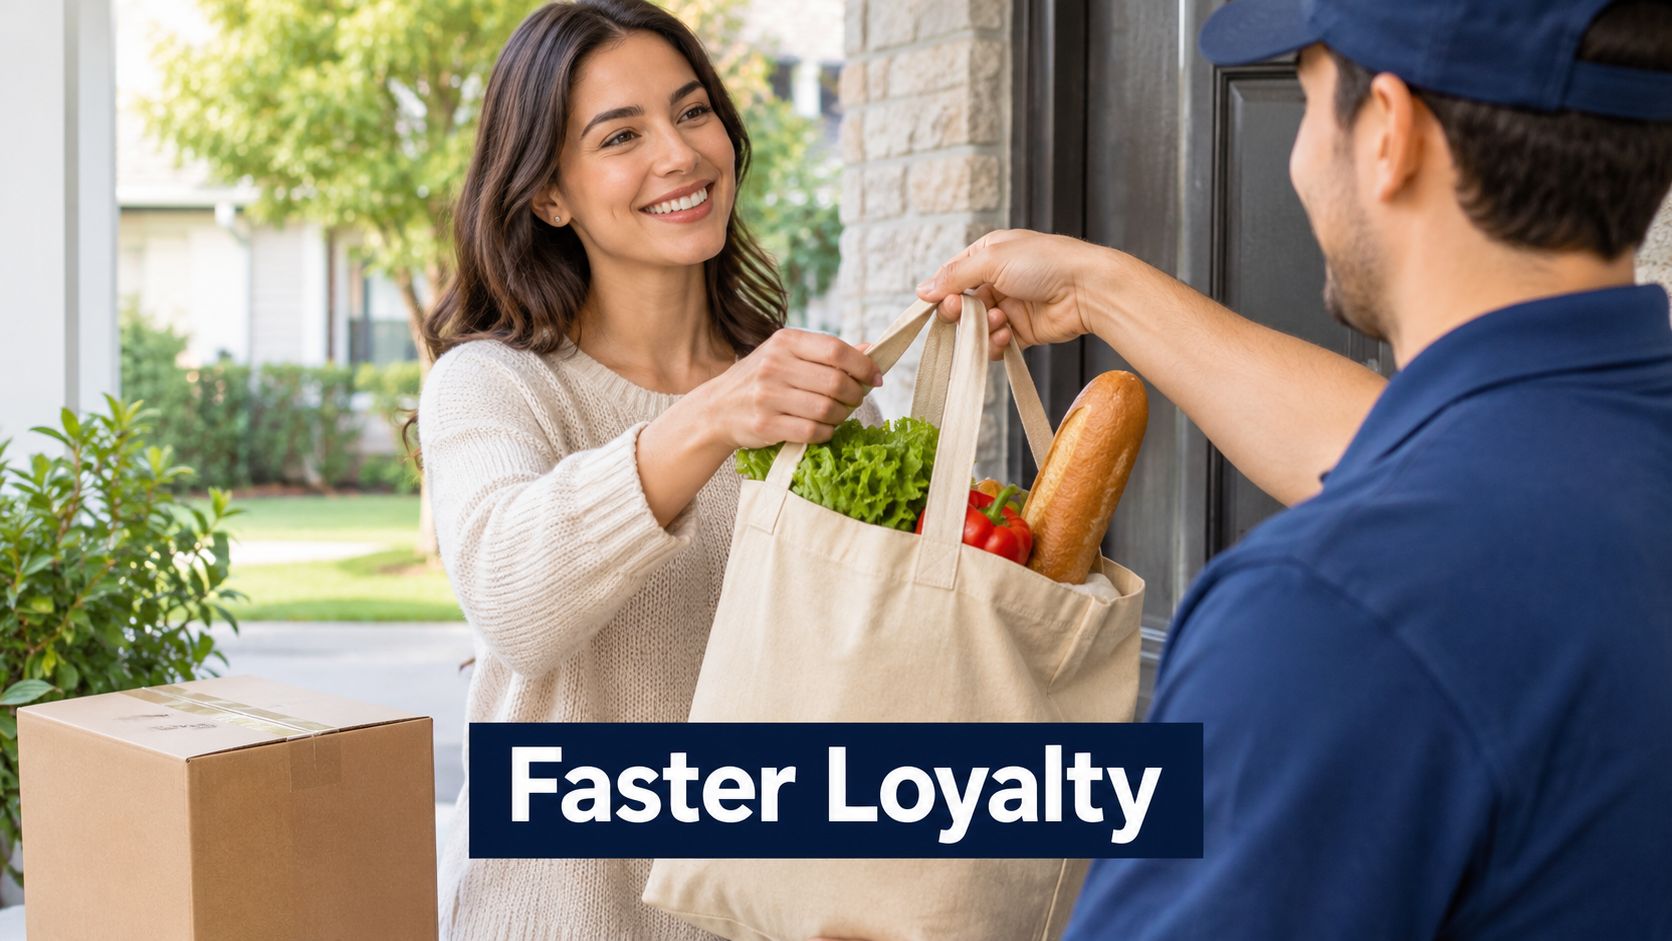
The following results were reported in Target's third-quarter 2025 earnings update, which also reported net sales down 1.5% year over year and comparable sales down 2.7% for the quarter.
Target's growth levers and open questions
| Lever | 2025 reported result | Open question |
|---|---|---|
| Digital comparable sales | Up 2.4% | Whether the growth is incremental |
| Same-day delivery | Grew more than 35% | Delivery subsidy per member not disclosed |
| Target Plus gross merchandise value | Grew nearly 50% | Whether it replaces first-party sales |
| Next-day delivery | Expanded to 35 major U.S. metro areas | Whether local order density supports profitable service |
| Same-day delivery reach | More than 80% of the U.S. population | Whether eligible households become profitable repeat customers |
These are quarterly growth signals and network-coverage disclosures, not proof of full-year profitability. Their coexistence with falling overall sales shows why a successful digital initiative shouldn't automatically be described as a successful enterprise turnaround.
Marketplace gross merchandise value also isn't interchangeable with Target's revenue or profit. Operators need to distinguish merchandise transacted through a platform from the amount the platform retains.
For additional context on the retailer's strategy, the following video accompanies the operating analysis.
The disclosures don't adequately establish Circle 360 customer lifetime value, incremental order frequency, churn, or delivery subsidy per member. They also don't settle whether marketplace purchases supplement first-party sales or displace them.
For your own brand, compare eligible customer cohorts with similar purchasing histories. Separate additional purchases from orders that merely moved from shipping or pickup into subsidized delivery.
Then assess the levers together. A membership benefit should earn its cost through retained contribution, a faster promise should fit local delivery economics, and broader assortment should add value after support and returns. Expanding any lever in isolation can produce an attractive growth chart without improving the business.
Start with how customers buy, not the network you'd like to announce. Deloitte's 2025 US Retail Industry Outlook reports that omnichannel shoppers spent 1.5 times more per month than single-channel shoppers. That's a reason to investigate the opportunity, not evidence that adding pickup causes the spending difference.
Use the planning sequence below to keep customer behavior ahead of infrastructure decisions.
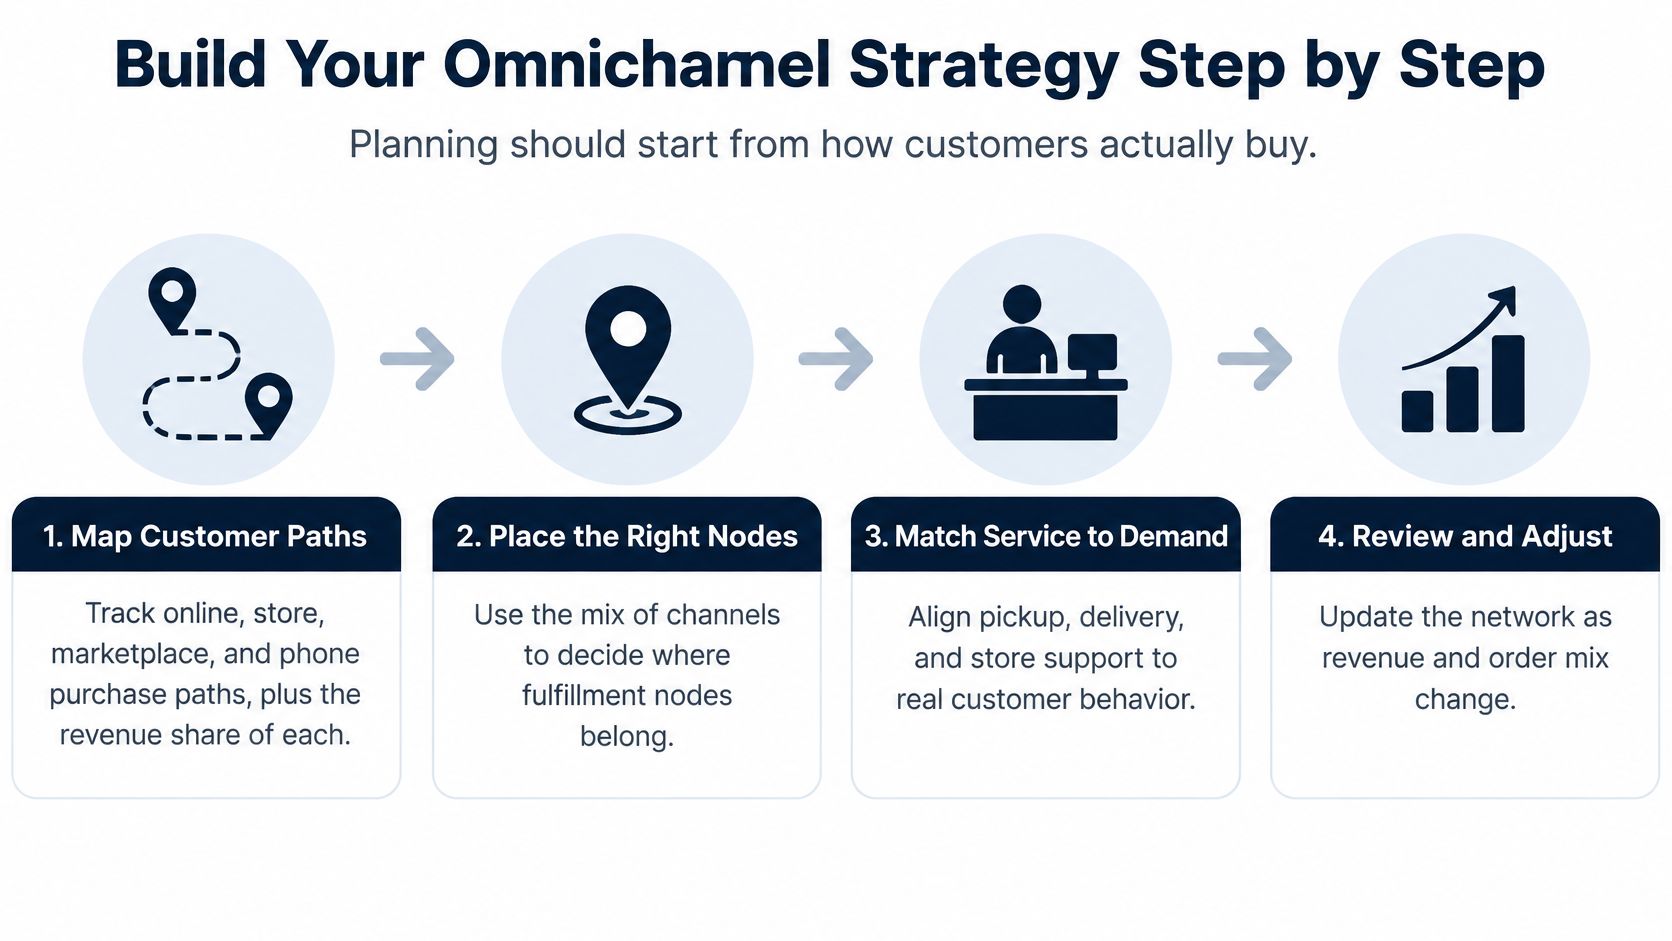
Map purchase paths. Reconcile website, store, marketplace, and phone orders against revenue. Planning from web traffic alone misses purchases completed elsewhere.
Select the initial regional node. Compare a store, third-party warehouse, dark store, or retail partner against actual order locations. Don't add buildings before demand supports them.
Synchronize inventory. Establish an authoritative inventory system, reservation rules, and safety buffers. Weekly counts alone aren't sufficient for a live availability promise.
Pilot collection. Define pickup windows, staging locations, identification checks, and uncollected-order procedures. Don't launch while staff are still improvising those rules.
Unify measurement. Record fulfillment method, promised-window hit rate, failed-pickup rate, and contribution margin per order. Separate channel revenue reports won't explain operational performance.
Connect customer identity. Link purchases where identification and platform permissions allow, and suppress irrelevant retargeting after collection. Silver Spoon Agency's omnichannel guidance for growing retailers provides context for coordinating messages across touchpoints.
Test the delivery promise. Limit the initial service area and expand only after examining exceptions and costs. Don't confuse successful dispatches with successful customer arrivals.
Unlike general founder organizations such as YPO or EO, we focus entirely on ecommerce operators. That focus matters when evaluating operational choices that cross merchandising, logistics, and customer acquisition.
We also partner with vendors for value, not kickbacks, and have no affiliate agenda. Evaluate recommendations against your own workflow and economics rather than treating a vendor introduction as proof of fit.
Start now if demand, inventory, ownership, and staffing are ready. Fix inventory first if availability is unreliable. Wait if regional order density can't support the proposed operation.
Readiness doesn't require copying Target's footprint. It requires a bounded service that your team can staff, measure, and improve without hiding its costs elsewhere in the business.
Run a pilot at a selected location and, as a practical testing period, track performance for at least a quarter. Review orders by fulfillment method, promised-window hit rate, failed-pickup rate, and contribution margin per order before deciding whether to expand.
For operators considering our community, omnichannel, DTC, and TikTok brands need $1M in trailing-twelve-month website revenue, and applicants must be founders or substantial equity holders. Commercial eligibility is separate from operational readiness: revenue alone doesn't establish that a local fulfillment node will work.
Million Dollar Sellers offers an ecommerce-focused peer network for comparing fulfillment decisions, operating assumptions, and growth trade-offs with other founders. Visit Million Dollar Sellers to explore the community and bring a specific question, such as whether your pickup pilot earns enough contribution to justify expansion.
Join the Ecommerce Community for Founders Scaling from 7 to 9 Figures
Learn MoreYou may also like:
Learn more about our events!
Check Events